BELMANIP_00302


Location

lon / lat [deg]: 101.9941 / -2.8965

Source network: BELMANIP


Geostationary surface albedo (GSA) data


“+000”


“+057/+063”


Landcover information (based on ESA CCI landcover data)


Landcover fractions @ 2km distance


Landcover fractions @ 20 km distance


Legend


Distance to open water bodies [km]:

22.88

Distance to urban areas [km]:

18.06


Radius: 1 km

Number of landcover classes:

1

Dominant landcover type:

50: Tree cover, broadleaved, evergreen, closed to open (>15%)

Fraction of dominant landcover type [%]:

100.0


Radius: 2 km

Number of landcover classes:

1

Dominant landcover type:

50: Tree cover, broadleaved, evergreen, closed to open (>15%)

Fraction of dominant landcover type [%]:

100.0


Radius: 5 km

Number of landcover classes:

1

Dominant landcover type:

50: Tree cover, broadleaved, evergreen, closed to open (>15%)

Fraction of dominant landcover type [%]:

100.0


Radius: 10 km

Number of landcover classes:

2

Dominant landcover type:

50: Tree cover, broadleaved, evergreen, closed to open (>15%)

Fraction of dominant landcover type [%]:

98.0


Radius: 20 km

Number of landcover classes:

2

Dominant landcover type:

50: Tree cover, broadleaved, evergreen, closed to open (>15%)

Fraction of dominant landcover type [%]:

98.0


Disturbances


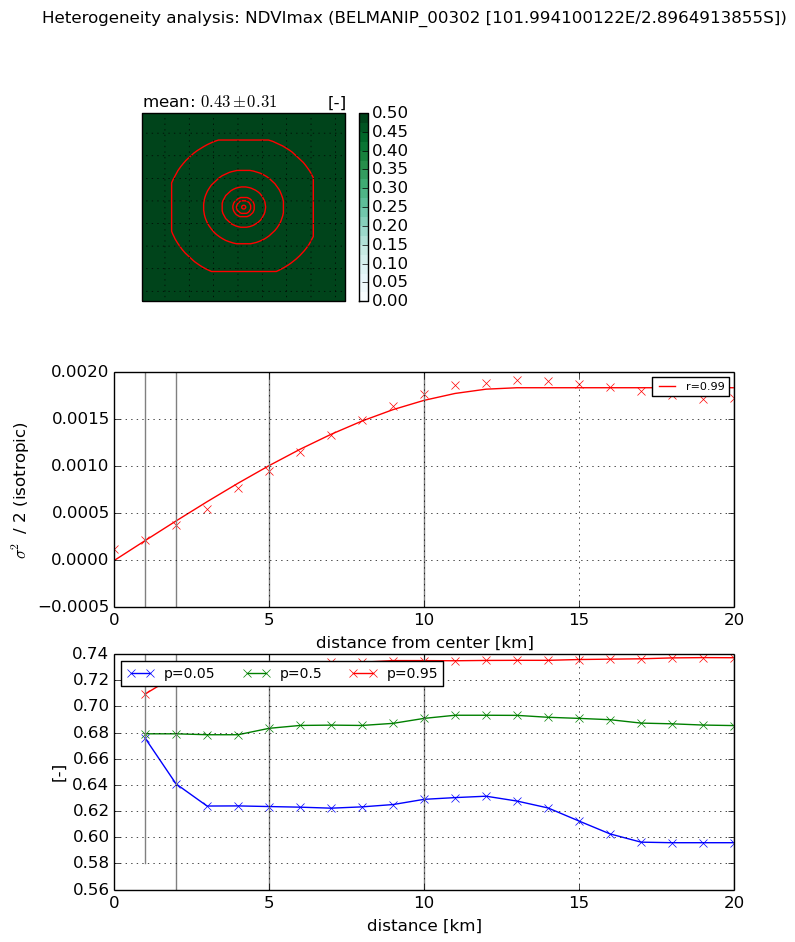
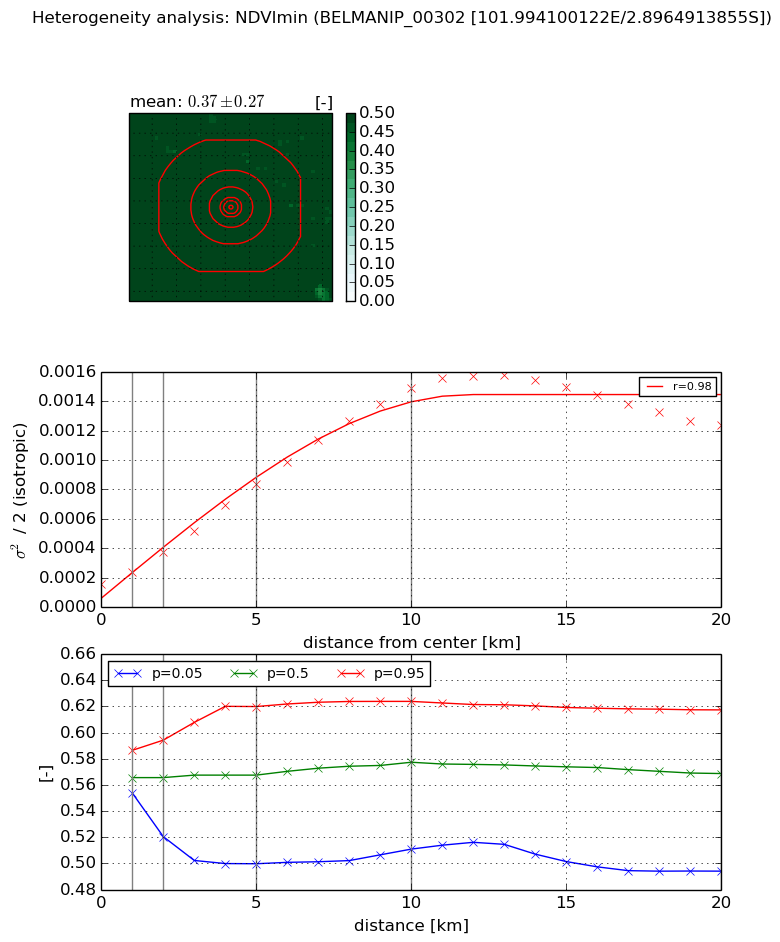
Heterogeneity analysis

The heterogeneity analysis provides information about the spatial and temporal heterogeneity of the site.

Topography


Roman et al. (2009) index


St

8.29432648797

Rcv

0.155845288055

Rse

0.0

Rst

-0.0464660847904

Rsv

0.1593816476


Height range @ 1km [m]

396

Height range @ 2km [m]

611

Height range @ 5km [m]

734

Height range @ 10km [m]

-999

Height range @ 20km [m]

-999


Variance slope @ 1 km

14622

Variance slope @ 2 km

15608

Variance slope @ 5 km

12262

Variance slope @ 10 km

-999

Variance slope @ 20 km

-999


NDVI (max. NDVI composite)


Roman et al. (2009) index


St

4.48279246022

Rcv

0.0464105241757

Rse

0.0

Rst

-0.114090777211

Rsv

0.50872441598


NDVI range @ 1km [-]

0.03

NDVI range @ 2km [-]

0.08

NDVI range @ 5km [-]

0.11

NDVI range @ 10km [-]

0.11

NDVI range @ 20km [-]

0.14


Variance slope @ 1 km

8.79412096099e-05

Variance slope @ 2 km

0.000126730430828

Variance slope @ 5 km

0.000170938013188

Variance slope @ 10 km

0.000174496855752

Variance slope @ 20 km

8.58676864485e-05


NDVI (min. NDVI composite)I


Roman et al. (2009) index


St

6.46323264747

Rcv

0.207863751284

Rse

0.0

Rst

-0.229738578134

Rsv

0.0265616831795


NDVI range @ 1km [-]

0.03

NDVI range @ 2km [-]

0.07

NDVI range @ 5km [-]

0.12

NDVI range @ 10km [-]

0.11

NDVI range @ 20km [-]

0.12


NDVI slope @ 1 km

7.97791636583e-05

NDVI slope @ 2 km

0.000110439905636

NDVI slope @ 5 km

0.000141185879834

NDVI slope @ 10 km

0.000140149902723

NDVI slope @ 20 km

5.952560746e-05


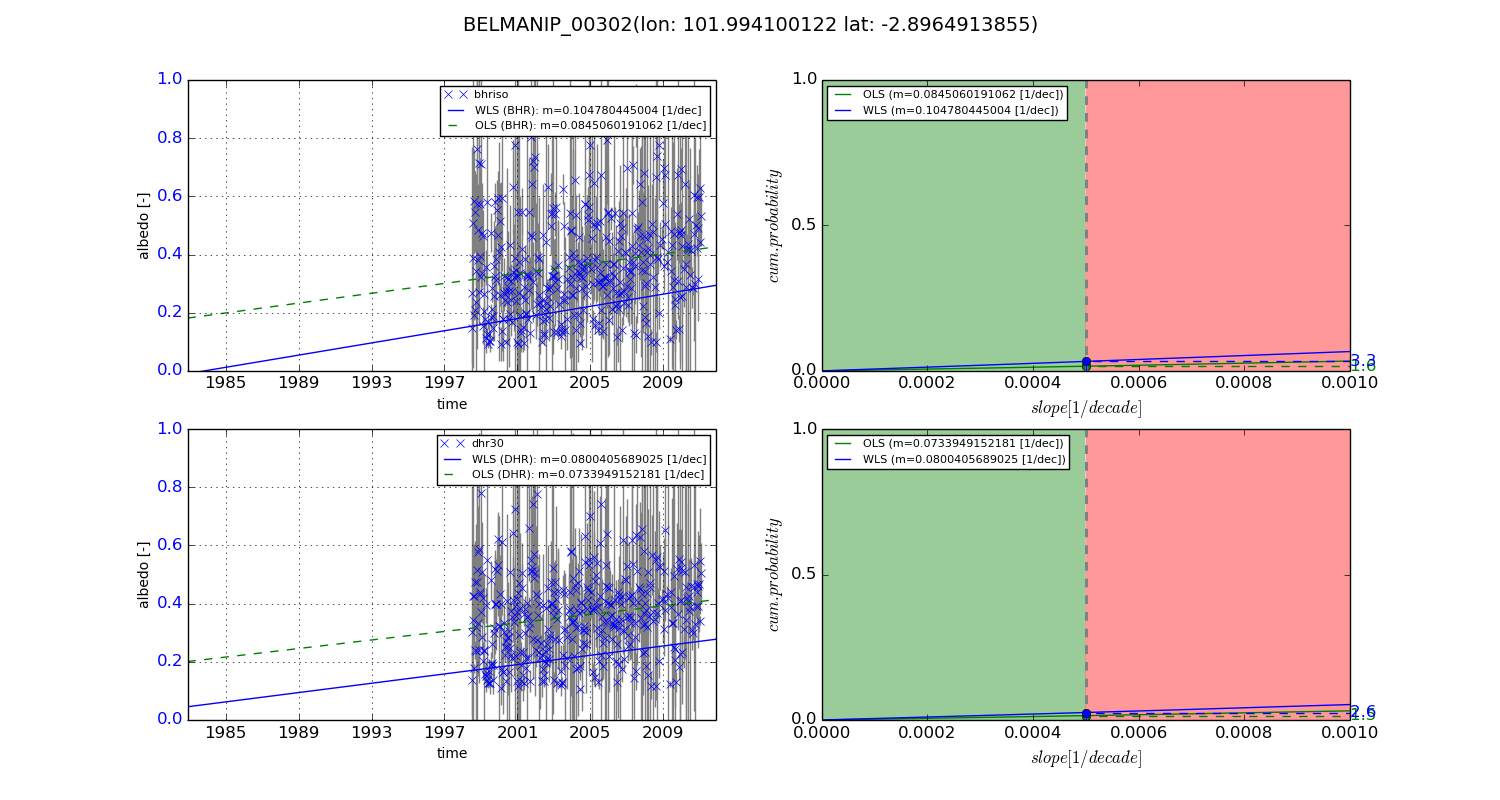
Temporal stability analysis

+000 deg (BHR)


BHR statistics

Temporal stability [1/decade]:


abs

rel


Weighted least square:

None


Ordinary least square:

None


Probabilities that GCOS criteria is met:

Weighted least square:

None %

Ordinary least square:

None %


DHR statistics

Temporal stability [1/decade]:


abs

rel


Weighted least square:

None


Ordinary least square:

None


Probabilities that GCOS criteria is met:

Weighted least square:

None %

Ordinary least square:

None %


+057/+063 deg (BHR)


BHR statistics

Temporal stability [1/decade]:


abs

rel


Weighted least square:

0.104780445004


Ordinary least square:

0.0845060191062


Probabilities that GCOS criteria is met:

Weighted least square:

3.3 %

Ordinary least square:

1.6 %


DHR statistics

Temporal stability [1/decade]:


abs

rel


Weighted least square:

0.0800405689025


Ordinary least square:

0.0733949152181


Probabilities that GCOS criteria is met:

Weighted least square:

2.6 %

Ordinary least square:

1.5 %


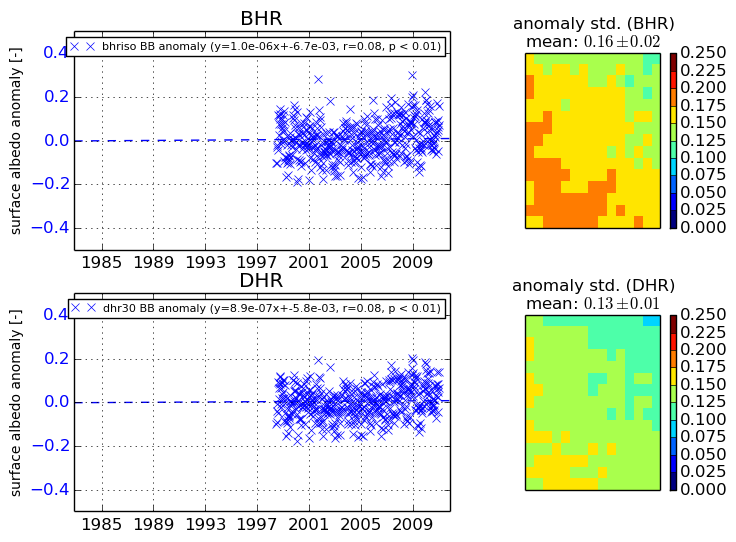
Temporal anomaly analyis

The variance of the temporal anomalies provides an additional measure about the stability of the signal AFTER removal of the mean seasonal cylce.

+000 deg


+057/+063 deg