BELMANIP_00303


Location

lon / lat [deg]: 120.3425 / -2.3097

Source network: BELMANIP


Geostationary surface albedo (GSA) data


“+000”


“+057/+063”


Landcover information (based on ESA CCI landcover data)


Landcover fractions @ 2km distance


Landcover fractions @ 20 km distance


Legend


Distance to open water bodies [km]:

22.57

Distance to urban areas [km]:

20.41


Radius: 1 km

Number of landcover classes:

1

Dominant landcover type:

50: Tree cover, broadleaved, evergreen, closed to open (>15%)

Fraction of dominant landcover type [%]:

100.0


Radius: 2 km

Number of landcover classes:

1

Dominant landcover type:

50: Tree cover, broadleaved, evergreen, closed to open (>15%)

Fraction of dominant landcover type [%]:

100.0


Radius: 5 km

Number of landcover classes:

1

Dominant landcover type:

50: Tree cover, broadleaved, evergreen, closed to open (>15%)

Fraction of dominant landcover type [%]:

100.0


Radius: 10 km

Number of landcover classes:

1

Dominant landcover type:

50: Tree cover, broadleaved, evergreen, closed to open (>15%)

Fraction of dominant landcover type [%]:

100.0


Radius: 20 km

Number of landcover classes:

2

Dominant landcover type:

50: Tree cover, broadleaved, evergreen, closed to open (>15%)

Fraction of dominant landcover type [%]:

96.0


Disturbances


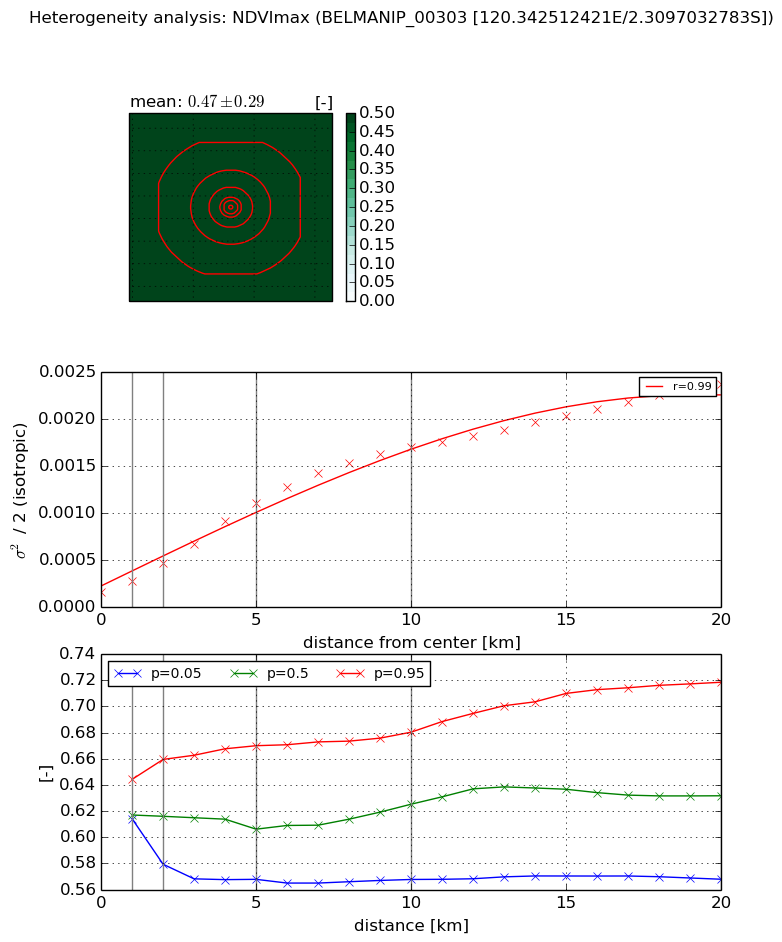
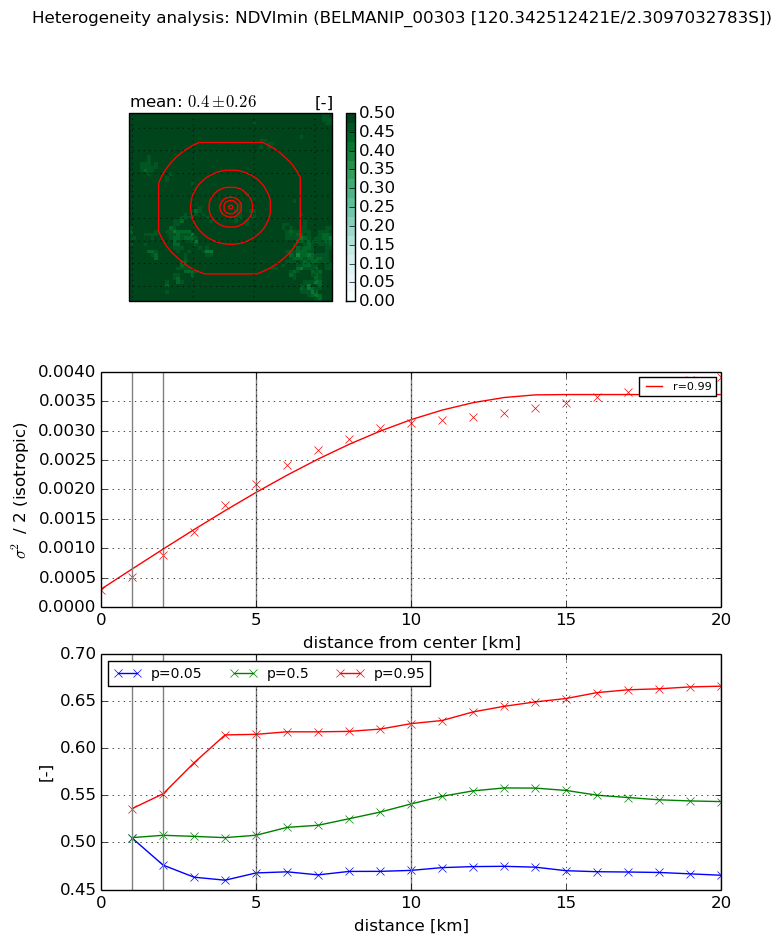
Heterogeneity analysis

The heterogeneity analysis provides information about the spatial and temporal heterogeneity of the site.

Topography


Roman et al. (2009) index


St

2.59230598971

Rcv

0.328861847128

Rse

0.0

Rst

-8.98470910577e-09

Rsv

-0.828408933641


Height range @ 1km [m]

215

Height range @ 2km [m]

423

Height range @ 5km [m]

934

Height range @ 10km [m]

-999

Height range @ 20km [m]

-999


Variance slope @ 1 km

11278

Variance slope @ 2 km

12625

Variance slope @ 5 km

16897

Variance slope @ 10 km

-999

Variance slope @ 20 km

-999


NDVI (max. NDVI composite)


Roman et al. (2009) index


St

4.73450225223

Rcv

0.067767955637

Rse

0.0

Rst

-0.0623248756549

Rsv

0.503553503671


NDVI range @ 1km [-]

0.03

NDVI range @ 2km [-]

0.08

NDVI range @ 5km [-]

0.1

NDVI range @ 10km [-]

0.11

NDVI range @ 20km [-]

0.15


Variance slope @ 1 km

0.000108909935027

Variance slope @ 2 km

0.000153061461451

Variance slope @ 5 km

0.00019479747167

Variance slope @ 10 km

0.000165046347251

Variance slope @ 20 km

0.000106395632068


NDVI (min. NDVI composite)I


Roman et al. (2009) index


St

2.9549458811

Rcv

0.244394891388

Rse

0.0

Rst

-0.452932785121

Rsv

0.317919343475


NDVI range @ 1km [-]

0.03

NDVI range @ 2km [-]

0.08

NDVI range @ 5km [-]

0.15

NDVI range @ 10km [-]

0.16

NDVI range @ 20km [-]

0.2


NDVI slope @ 1 km

0.000210368139082

NDVI slope @ 2 km

0.000297474744215

NDVI slope @ 5 km

0.0003727641438

NDVI slope @ 10 km

0.000305829947307

NDVI slope @ 20 km

0.000169680458253


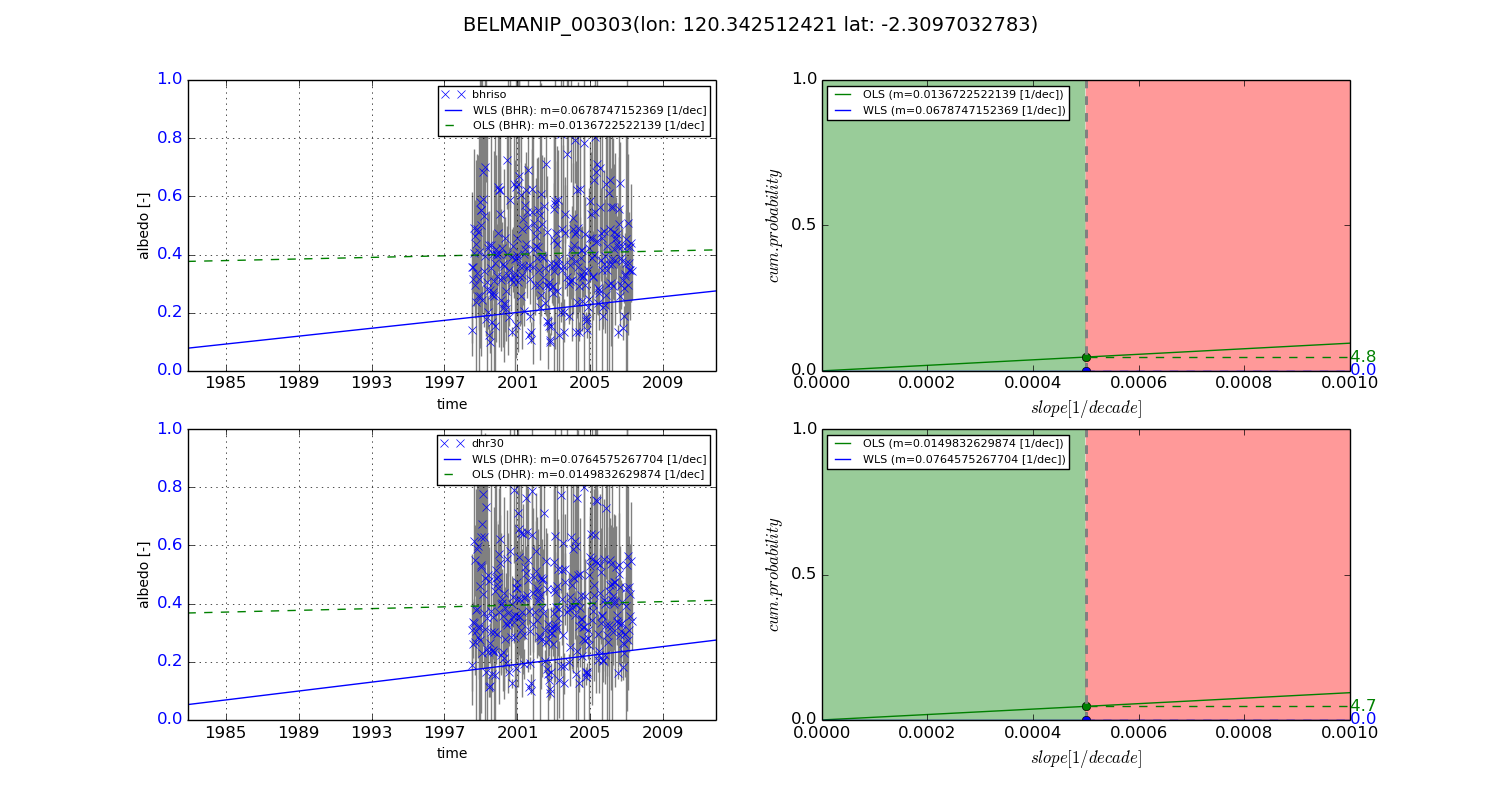
Temporal stability analysis

+000 deg (BHR)


BHR statistics

Temporal stability [1/decade]:


abs

rel


Weighted least square:

None


Ordinary least square:

None


Probabilities that GCOS criteria is met:

Weighted least square:

None %

Ordinary least square:

None %


DHR statistics

Temporal stability [1/decade]:


abs

rel


Weighted least square:

None


Ordinary least square:

None


Probabilities that GCOS criteria is met:

Weighted least square:

None %

Ordinary least square:

None %


+057/+063 deg (BHR)


BHR statistics

Temporal stability [1/decade]:


abs

rel


Weighted least square:

0.0678747152369


Ordinary least square:

0.0136722522139


Probabilities that GCOS criteria is met:

Weighted least square:

0.0 %

Ordinary least square:

4.8 %


DHR statistics

Temporal stability [1/decade]:


abs

rel


Weighted least square:

0.0764575267704


Ordinary least square:

0.0149832629874


Probabilities that GCOS criteria is met:

Weighted least square:

0.0 %

Ordinary least square:

4.7 %


Temporal anomaly analyis

The variance of the temporal anomalies provides an additional measure about the stability of the signal AFTER removal of the mean seasonal cylce.

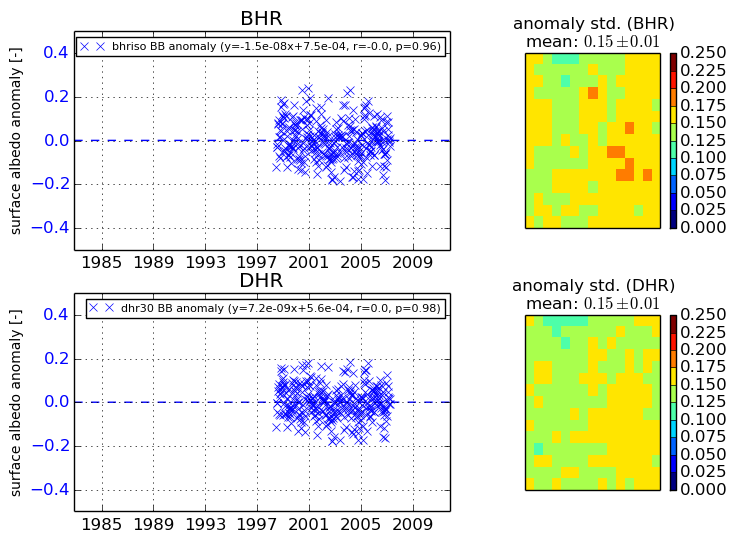
+000 deg


+057/+063 deg