BELMANIP_00304


Location

lon / lat [deg]: 137.2795 / -3.5671

Source network: BELMANIP


Geostationary surface albedo (GSA) data


“+000”


“+057/+063”


Landcover information (based on ESA CCI landcover data)


Landcover fractions @ 2km distance


Landcover fractions @ 20 km distance


Legend


Distance to open water bodies [km]:

15.85

Distance to urban areas [km]:

none in region


Radius: 1 km

Number of landcover classes:

1

Dominant landcover type:

50: Tree cover, broadleaved, evergreen, closed to open (>15%)

Fraction of dominant landcover type [%]:

100.0


Radius: 2 km

Number of landcover classes:

1

Dominant landcover type:

50: Tree cover, broadleaved, evergreen, closed to open (>15%)

Fraction of dominant landcover type [%]:

100.0


Radius: 5 km

Number of landcover classes:

1

Dominant landcover type:

50: Tree cover, broadleaved, evergreen, closed to open (>15%)

Fraction of dominant landcover type [%]:

100.0


Radius: 10 km

Number of landcover classes:

1

Dominant landcover type:

50: Tree cover, broadleaved, evergreen, closed to open (>15%)

Fraction of dominant landcover type [%]:

100.0


Radius: 20 km

Number of landcover classes:

1

Dominant landcover type:

50: Tree cover, broadleaved, evergreen, closed to open (>15%)

Fraction of dominant landcover type [%]:

100.0


Disturbances


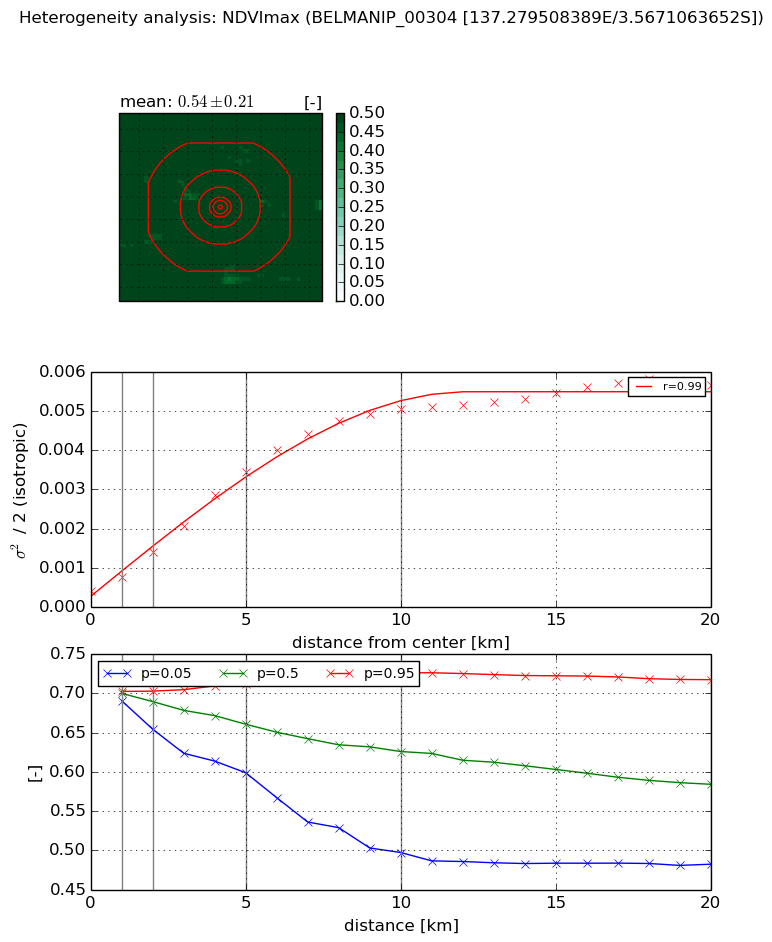
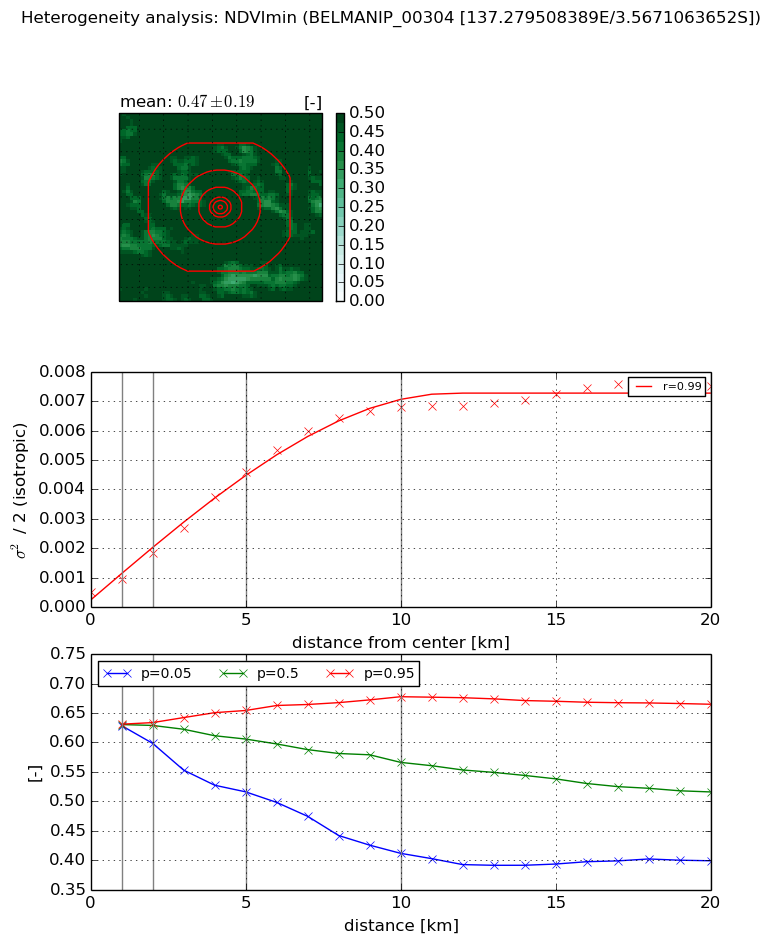
Heterogeneity analysis

The heterogeneity analysis provides information about the spatial and temporal heterogeneity of the site.

Topography


Roman et al. (2009) index


St

8.17555076707

Rcv

0.204109306242

Rse

0.0

Rst

-0.0565684467531

Rsv

0.106270002021


Height range @ 1km [m]

654

Height range @ 2km [m]

930

Height range @ 5km [m]

1383

Height range @ 10km [m]

-999

Height range @ 20km [m]

-999


Variance slope @ 1 km

39819

Variance slope @ 2 km

45759

Variance slope @ 5 km

47988

Variance slope @ 10 km

-999

Variance slope @ 20 km

-999


NDVI (max. NDVI composite)


Roman et al. (2009) index


St

1.59261008428

Rcv

0.398598968537

Rse

0.0

Rst

-0.485101563632

Rsv

-0.999999709096


NDVI range @ 1km [-]

0.01

NDVI range @ 2km [-]

0.05

NDVI range @ 5km [-]

0.11

NDVI range @ 10km [-]

0.23

NDVI range @ 20km [-]

0.24


Variance slope @ 1 km

0.000352779756604

Variance slope @ 2 km

0.00050312979728

Variance slope @ 5 km

0.000631390142502

Variance slope @ 10 km

0.000506365234136

Variance slope @ 20 km

0.000251747249736


NDVI (min. NDVI composite)I


Roman et al. (2009) index


St

1.46053896807

Rcv

0.615695635927

Rse

0.0

Rst

-0.438340720611

Rsv

-0.99999990377


NDVI range @ 1km [-]

0.0

NDVI range @ 2km [-]

0.04

NDVI range @ 5km [-]

0.14

NDVI range @ 10km [-]

0.27

NDVI range @ 20km [-]

0.27


NDVI slope @ 1 km

0.000461615875528

NDVI slope @ 2 km

0.000661117522546

NDVI slope @ 5 km

0.000845641324371

NDVI slope @ 10 km

0.00069314378443

NDVI slope @ 20 km

0.000334037845995


Temporal stability analysis

+000 deg (BHR)


BHR statistics

Temporal stability [1/decade]:


abs

rel


Weighted least square:

None


Ordinary least square:

None


Probabilities that GCOS criteria is met:

Weighted least square:

None %

Ordinary least square:

None %


DHR statistics

Temporal stability [1/decade]:


abs

rel


Weighted least square:

None


Ordinary least square:

None


Probabilities that GCOS criteria is met:

Weighted least square:

None %

Ordinary least square:

None %


+057/+063 deg (BHR)


BHR statistics

Temporal stability [1/decade]:


abs

rel


Weighted least square:

-99999.0


Ordinary least square:

-99999.0


Probabilities that GCOS criteria is met:

Weighted least square:

-99999.0 %

Ordinary least square:

-99999.0 %


DHR statistics

Temporal stability [1/decade]:


abs

rel


Weighted least square:

-99999.0


Ordinary least square:

-99999.0


Probabilities that GCOS criteria is met:

Weighted least square:

-99999.0 %

Ordinary least square:

-99999.0 %


Temporal anomaly analyis

The variance of the temporal anomalies provides an additional measure about the stability of the signal AFTER removal of the mean seasonal cylce.

+000 deg


+057/+063 deg