BELMANIP_00308


Location

lon / lat [deg]: 97.4574 / 3.6666

Source network: BELMANIP


Geostationary surface albedo (GSA) data


“+000”


“+057/+063”


Landcover information (based on ESA CCI landcover data)


Landcover fractions @ 2km distance


Landcover fractions @ 20 km distance


Legend


Distance to open water bodies [km]:

49.9

Distance to urban areas [km]:

37.52


Radius: 1 km

Number of landcover classes:

1

Dominant landcover type:

50: Tree cover, broadleaved, evergreen, closed to open (>15%)

Fraction of dominant landcover type [%]:

100.0


Radius: 2 km

Number of landcover classes:

1

Dominant landcover type:

50: Tree cover, broadleaved, evergreen, closed to open (>15%)

Fraction of dominant landcover type [%]:

100.0


Radius: 5 km

Number of landcover classes:

1

Dominant landcover type:

50: Tree cover, broadleaved, evergreen, closed to open (>15%)

Fraction of dominant landcover type [%]:

100.0


Radius: 10 km

Number of landcover classes:

1

Dominant landcover type:

50: Tree cover, broadleaved, evergreen, closed to open (>15%)

Fraction of dominant landcover type [%]:

100.0


Radius: 20 km

Number of landcover classes:

2

Dominant landcover type:

50: Tree cover, broadleaved, evergreen, closed to open (>15%)

Fraction of dominant landcover type [%]:

98.0


Disturbances


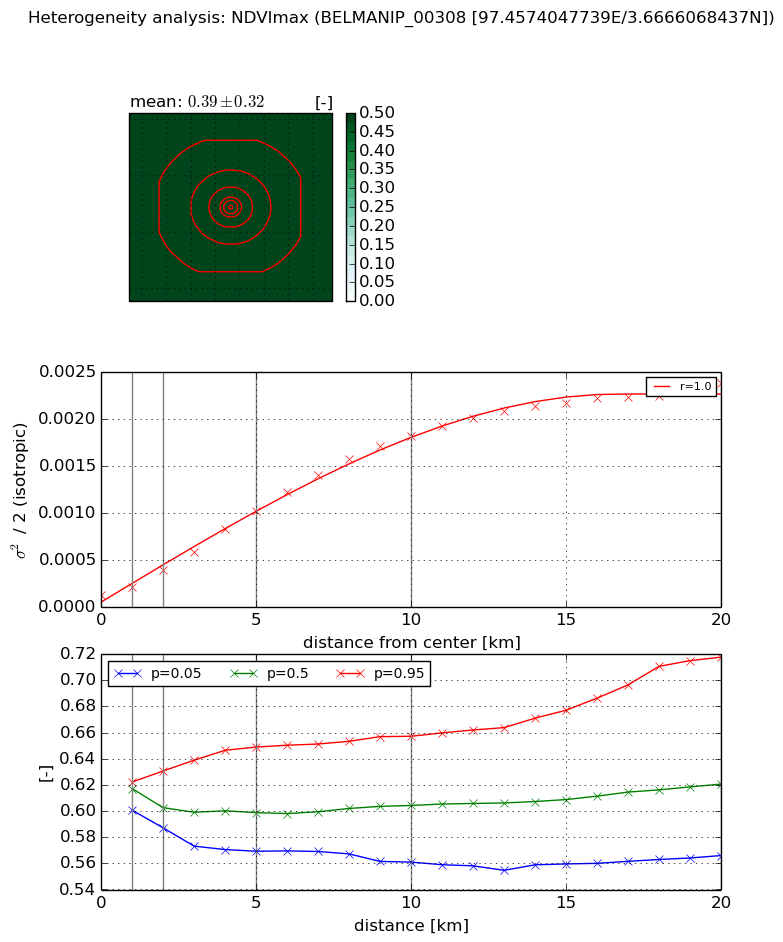
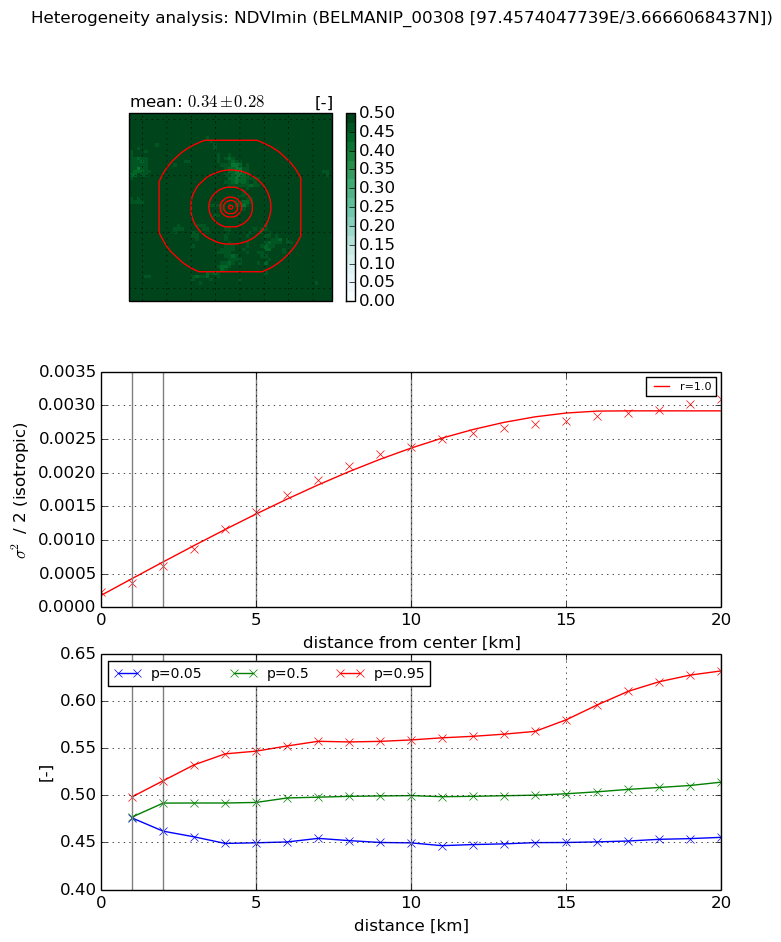
Heterogeneity analysis

The heterogeneity analysis provides information about the spatial and temporal heterogeneity of the site.

Topography


Roman et al. (2009) index


St

8.22870725103

Rcv

0.222304297219

Rse

0.0

Rst

-0.0968194511125

Rsv

-0.0454535672146


Height range @ 1km [m]

332

Height range @ 2km [m]

480

Height range @ 5km [m]

822

Height range @ 10km [m]

-999

Height range @ 20km [m]

-999


Variance slope @ 1 km

17046

Variance slope @ 2 km

19944

Variance slope @ 5 km

14939

Variance slope @ 10 km

-999

Variance slope @ 20 km

-999


NDVI (max. NDVI composite)


Roman et al. (2009) index


St

2.48635765101

Rcv

0.212667613616

Rse

0.0

Rst

-0.214063959458

Rsv

0.779852684338


NDVI range @ 1km [-]

0.02

NDVI range @ 2km [-]

0.04

NDVI range @ 5km [-]

0.08

NDVI range @ 10km [-]

0.1

NDVI range @ 20km [-]

0.15


Variance slope @ 1 km

9.32950033152e-05

Variance slope @ 2 km

0.000134708183345

Variance slope @ 5 km

0.000186165135624

Variance slope @ 10 km

0.00018194181124

Variance slope @ 20 km

0.000115094957204


NDVI (min. NDVI composite)I


Roman et al. (2009) index


St

3.62737722622

Rcv

0.227663857505

Rse

0.0

Rst

-0.130589976768

Rsv

0.4687900084


NDVI range @ 1km [-]

0.02

NDVI range @ 2km [-]

0.05

NDVI range @ 5km [-]

0.1

NDVI range @ 10km [-]

0.11

NDVI range @ 20km [-]

0.18


NDVI slope @ 1 km

0.00013749749793

NDVI slope @ 2 km

0.000193916578732

NDVI slope @ 5 km

0.000247214316904

NDVI slope @ 10 km

0.000231985150488

NDVI slope @ 20 km

0.0001429933304


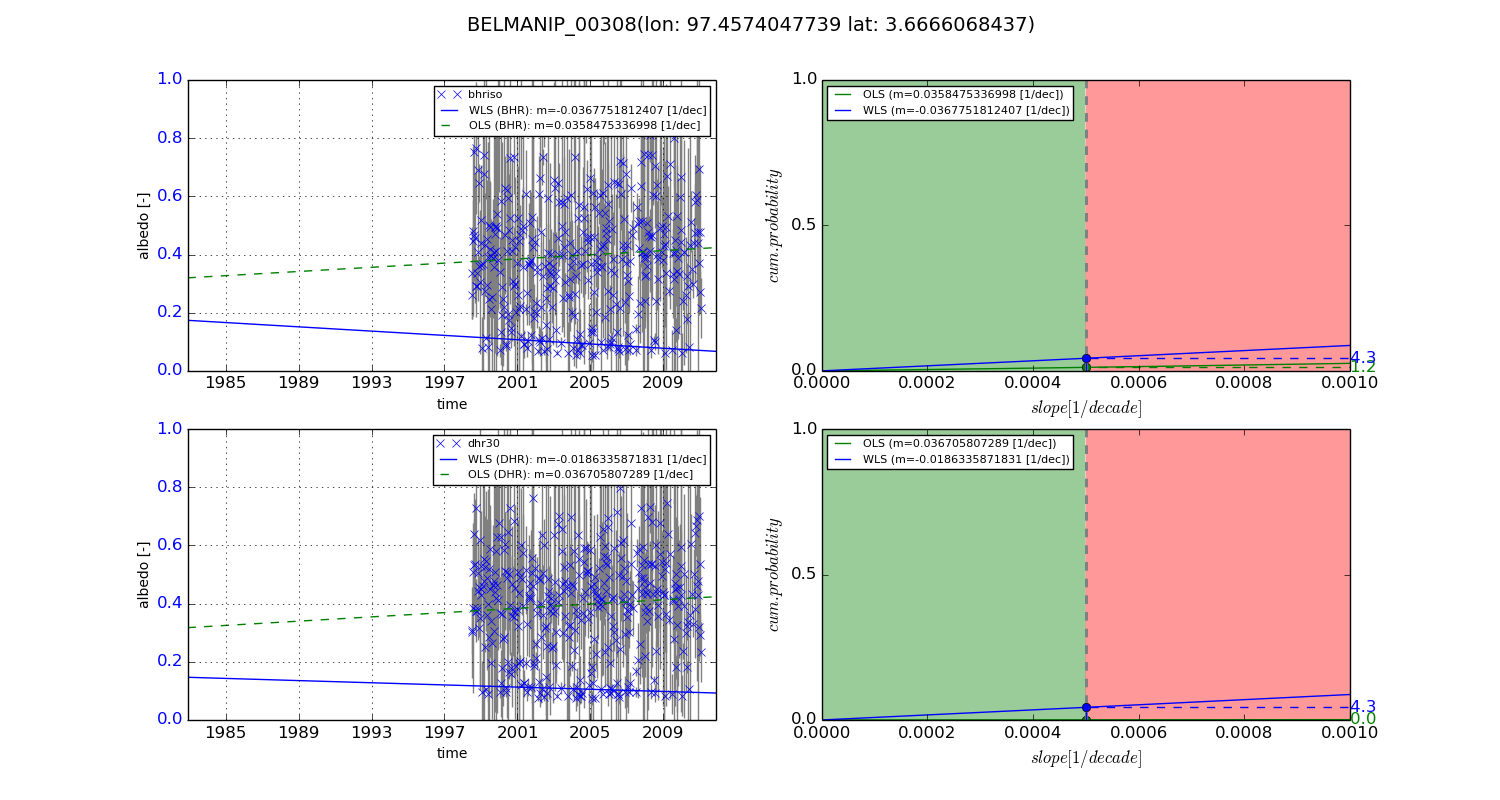
Temporal stability analysis

+000 deg (BHR)


BHR statistics

Temporal stability [1/decade]:


abs

rel


Weighted least square:

None


Ordinary least square:

None


Probabilities that GCOS criteria is met:

Weighted least square:

None %

Ordinary least square:

None %


DHR statistics

Temporal stability [1/decade]:


abs

rel


Weighted least square:

None


Ordinary least square:

None


Probabilities that GCOS criteria is met:

Weighted least square:

None %

Ordinary least square:

None %


+057/+063 deg (BHR)


BHR statistics

Temporal stability [1/decade]:


abs

rel


Weighted least square:

-0.0367751812407


Ordinary least square:

0.0358475336998


Probabilities that GCOS criteria is met:

Weighted least square:

4.3 %

Ordinary least square:

1.2 %


DHR statistics

Temporal stability [1/decade]:


abs

rel


Weighted least square:

-0.0186335871831


Ordinary least square:

0.036705807289


Probabilities that GCOS criteria is met:

Weighted least square:

4.3 %

Ordinary least square:

0.0 %


Temporal anomaly analyis

The variance of the temporal anomalies provides an additional measure about the stability of the signal AFTER removal of the mean seasonal cylce.

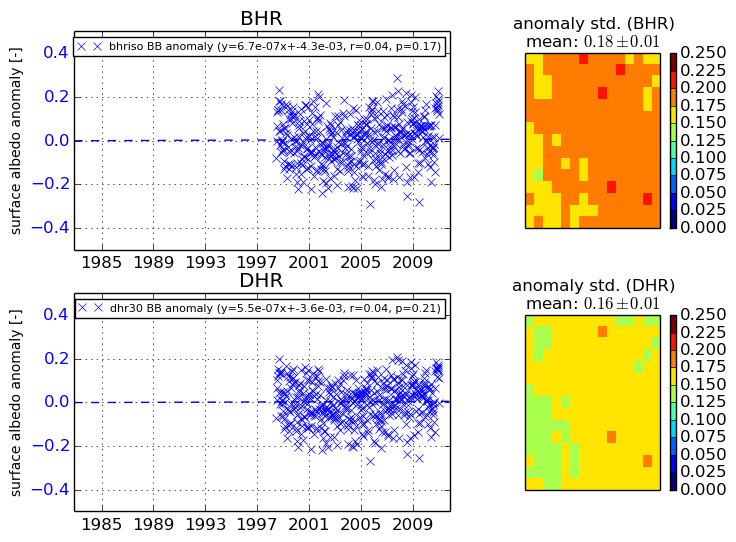
+000 deg


+057/+063 deg