BELMANIP_00310


Location

lon / lat [deg]: 122.7621 / 9.7378

Source network: BELMANIP


Geostationary surface albedo (GSA) data


“+000”


“+057/+063”


Landcover information (based on ESA CCI landcover data)


Landcover fractions @ 2km distance


Landcover fractions @ 20 km distance


Legend


Distance to open water bodies [km]:

27.96

Distance to urban areas [km]:

23.66


Radius: 1 km

Number of landcover classes:

2

Dominant landcover type:

30: mosaic cropland (>50%), natural veg. (< 50%)

Fraction of dominant landcover type [%]:

74.0


Radius: 2 km

Number of landcover classes:

2

Dominant landcover type:

30: mosaic cropland (>50%), natural veg. (< 50%)

Fraction of dominant landcover type [%]:

86.0


Radius: 5 km

Number of landcover classes:

2

Dominant landcover type:

30: mosaic cropland (>50%), natural veg. (< 50%)

Fraction of dominant landcover type [%]:

76.0


Radius: 10 km

Number of landcover classes:

2

Dominant landcover type:

30: mosaic cropland (>50%), natural veg. (< 50%)

Fraction of dominant landcover type [%]:

73.0


Radius: 20 km

Number of landcover classes:

2

Dominant landcover type:

30: mosaic cropland (>50%), natural veg. (< 50%)

Fraction of dominant landcover type [%]:

71.0


Disturbances


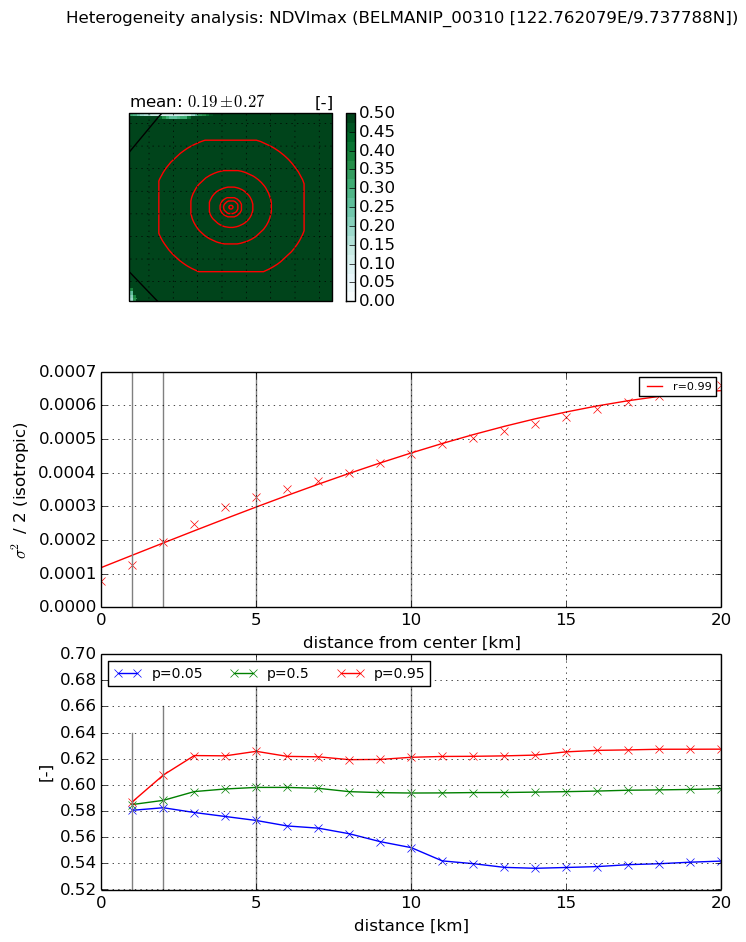
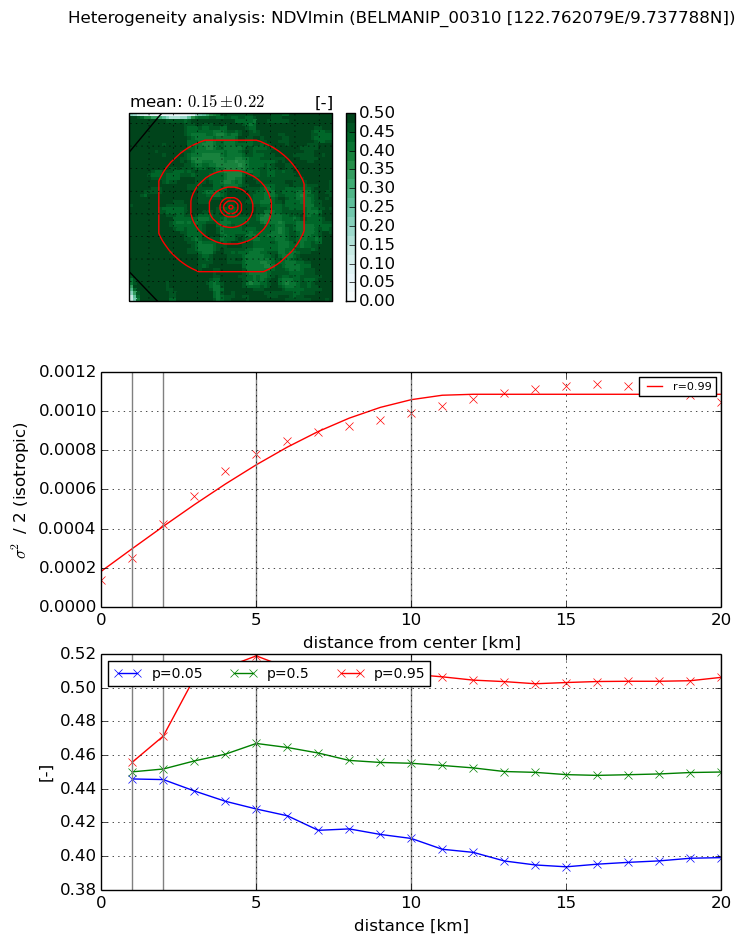
Heterogeneity analysis

The heterogeneity analysis provides information about the spatial and temporal heterogeneity of the site.

Topography


Roman et al. (2009) index


St

3.98128927259

Rcv

0.424108701384

Rse

0.0

Rst

0.111832653751

Rsv

-0.217583393909


Height range @ 1km [m]

96

Height range @ 2km [m]

110

Height range @ 5km [m]

173

Height range @ 10km [m]

-999

Height range @ 20km [m]

-999


Variance slope @ 1 km

715

Variance slope @ 2 km

670

Variance slope @ 5 km

635

Variance slope @ 10 km

-999

Variance slope @ 20 km

-999


NDVI (max. NDVI composite)


Roman et al. (2009) index


St

2.12263339981

Rcv

0.231138845717

Rse

0.0

Rst

-0.182200069606

Rsv

-0.999999817717


NDVI range @ 1km [-]

0.01

NDVI range @ 2km [-]

0.02

NDVI range @ 5km [-]

0.05

NDVI range @ 10km [-]

0.07

NDVI range @ 20km [-]

0.09


Variance slope @ 1 km

4.47642265515e-05

Variance slope @ 2 km

5.71093275609e-05

Variance slope @ 5 km

5.17875957078e-05

Variance slope @ 10 km

3.66773257653e-05

Variance slope @ 20 km

2.7207266177e-05


NDVI (min. NDVI composite)I


Roman et al. (2009) index


St

1.90461109229

Rcv

0.323262976547

Rse

0.0

Rst

-0.251861948166

Rsv

-0.999999788221


NDVI range @ 1km [-]

0.01

NDVI range @ 2km [-]

0.03

NDVI range @ 5km [-]

0.09

NDVI range @ 10km [-]

0.1

NDVI range @ 20km [-]

0.11


NDVI slope @ 1 km

0.000109500982507

NDVI slope @ 2 km

0.000142358309022

NDVI slope @ 5 km

0.000133435831963

NDVI slope @ 10 km

8.52486614816e-05

NDVI slope @ 20 km

4.19926330928e-05


Temporal stability analysis

+000 deg (BHR)


BHR statistics

Temporal stability [1/decade]:


abs

rel


Weighted least square:

None


Ordinary least square:

None


Probabilities that GCOS criteria is met:

Weighted least square:

None %

Ordinary least square:

None %


DHR statistics

Temporal stability [1/decade]:


abs

rel


Weighted least square:

None


Ordinary least square:

None


Probabilities that GCOS criteria is met:

Weighted least square:

None %

Ordinary least square:

None %


+057/+063 deg (BHR)


BHR statistics

Temporal stability [1/decade]:


abs

rel


Weighted least square:

-99999.0


Ordinary least square:

-99999.0


Probabilities that GCOS criteria is met:

Weighted least square:

-99999.0 %

Ordinary least square:

-99999.0 %


DHR statistics

Temporal stability [1/decade]:


abs

rel


Weighted least square:

-99999.0


Ordinary least square:

-99999.0


Probabilities that GCOS criteria is met:

Weighted least square:

-99999.0 %

Ordinary least square:

-99999.0 %


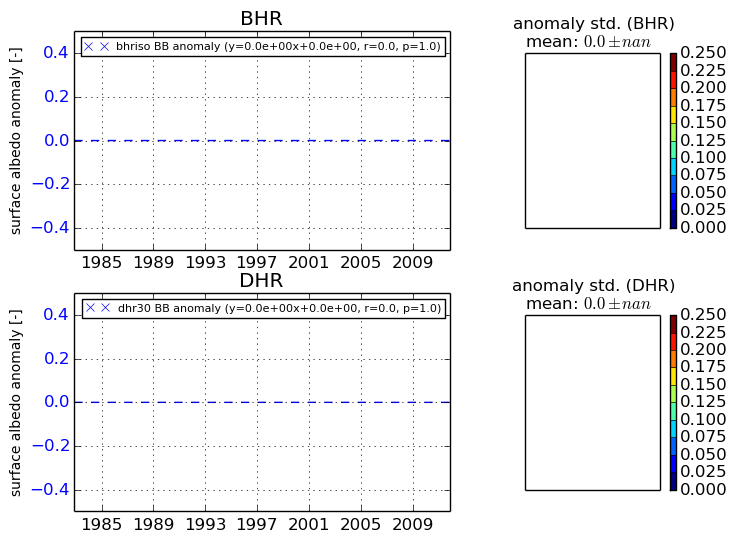
Temporal anomaly analyis

The variance of the temporal anomalies provides an additional measure about the stability of the signal AFTER removal of the mean seasonal cylce.

+000 deg


+057/+063 deg