BELMANIP_00311


Location

lon / lat [deg]: 103.4055 / 11.923

Source network: BELMANIP


Geostationary surface albedo (GSA) data


“+000”


“+057/+063”


Landcover information (based on ESA CCI landcover data)


Landcover fractions @ 2km distance


Landcover fractions @ 20 km distance


Legend


Distance to open water bodies [km]:

41.77

Distance to urban areas [km]:

55.22


Radius: 1 km

Number of landcover classes:

2

Dominant landcover type:

50: Tree cover, broadleaved, evergreen, closed to open (>15%)

Fraction of dominant landcover type [%]:

97.0


Radius: 2 km

Number of landcover classes:

2

Dominant landcover type:

50: Tree cover, broadleaved, evergreen, closed to open (>15%)

Fraction of dominant landcover type [%]:

98.0


Radius: 5 km

Number of landcover classes:

3

Dominant landcover type:

50: Tree cover, broadleaved, evergreen, closed to open (>15%)

Fraction of dominant landcover type [%]:

93.0


Radius: 10 km

Number of landcover classes:

3

Dominant landcover type:

50: Tree cover, broadleaved, evergreen, closed to open (>15%)

Fraction of dominant landcover type [%]:

95.0


Radius: 20 km

Number of landcover classes:

3

Dominant landcover type:

50: Tree cover, broadleaved, evergreen, closed to open (>15%)

Fraction of dominant landcover type [%]:

95.0


Disturbances


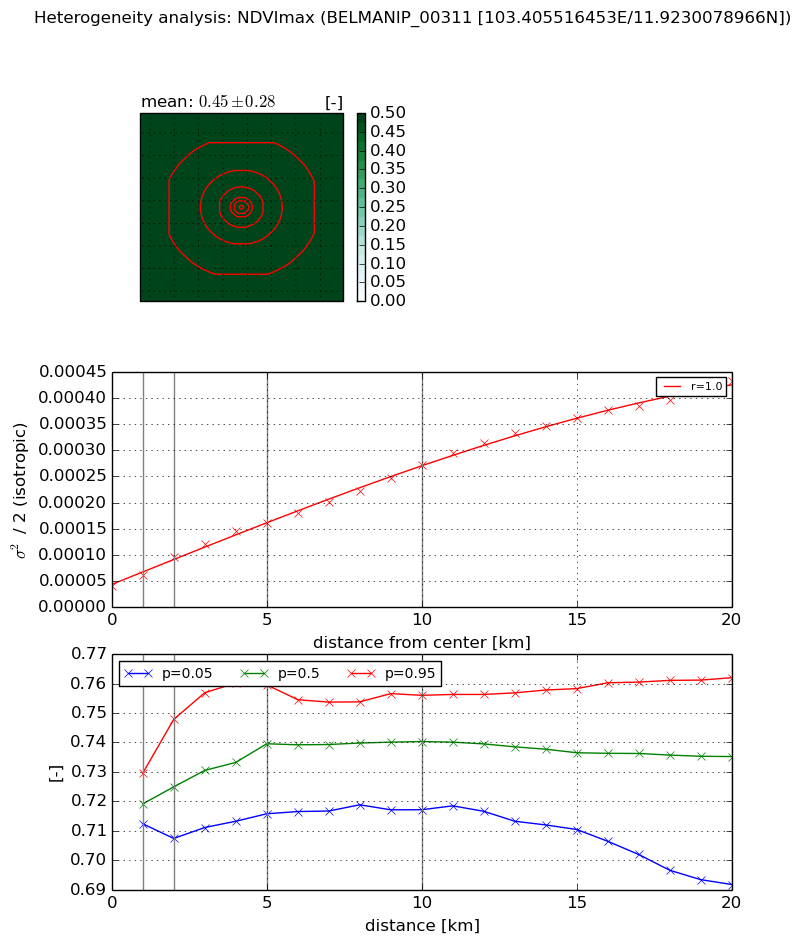
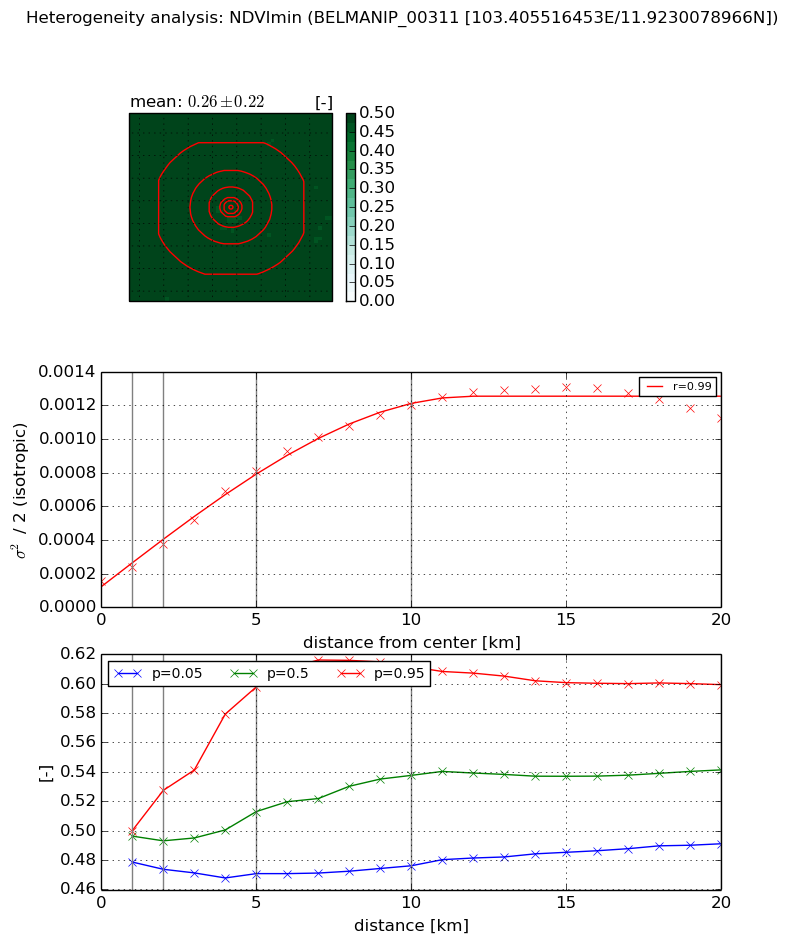
Heterogeneity analysis

The heterogeneity analysis provides information about the spatial and temporal heterogeneity of the site.

Topography


Roman et al. (2009) index


St

4.07109260003

Rcv

0.600663360866

Rse

0.0

Rst

0.121752020967

Rsv

0.0144875321369


Height range @ 1km [m]

235

Height range @ 2km [m]

354

Height range @ 5km [m]

611

Height range @ 10km [m]

-999

Height range @ 20km [m]

-999


Variance slope @ 1 km

8370

Variance slope @ 2 km

9836

Variance slope @ 5 km

8475

Variance slope @ 10 km

-999

Variance slope @ 20 km

-999


NDVI (max. NDVI composite)


Roman et al. (2009) index


St

8.91964688569

Rcv

-0.137416315787

Rse

0.0

Rst

-0.0360105377247

Rsv

0.162909330919


NDVI range @ 1km [-]

0.02

NDVI range @ 2km [-]

0.04

NDVI range @ 5km [-]

0.04

NDVI range @ 10km [-]

0.04

NDVI range @ 20km [-]

0.07


Variance slope @ 1 km

2.09070570929e-05

Variance slope @ 2 km

2.69787723924e-05

Variance slope @ 5 km

2.50483630022e-05

Variance slope @ 10 km

2.24447318868e-05

Variance slope @ 20 km

1.95004318028e-05


NDVI (min. NDVI composite)I


Roman et al. (2009) index


St

1.34673488231e-07

Rcv

0.568215756611

Rse

0.0

Rst

0.0997445161028

Rsv

22276098.6549


NDVI range @ 1km [-]

0.02

NDVI range @ 2km [-]

0.05

NDVI range @ 5km [-]

0.13

NDVI range @ 10km [-]

0.14

NDVI range @ 20km [-]

0.11


NDVI slope @ 1 km

7.93756280035e-05

NDVI slope @ 2 km

0.000110088659904

NDVI slope @ 5 km

0.000135817119052

NDVI slope @ 10 km

0.000110707534545

NDVI slope @ 20 km

5.11704056271e-05


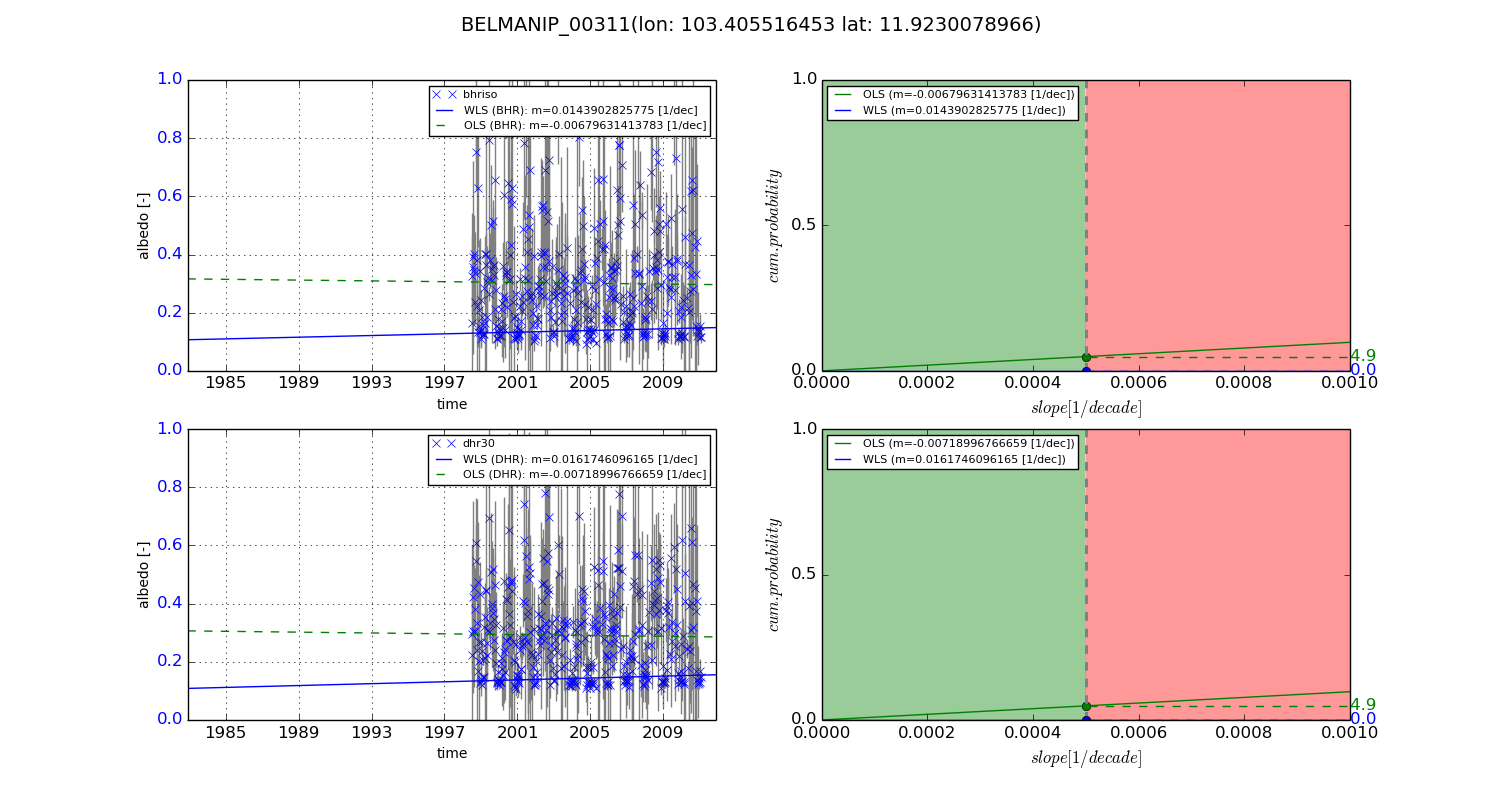
Temporal stability analysis

+000 deg (BHR)


BHR statistics

Temporal stability [1/decade]:


abs

rel


Weighted least square:

None


Ordinary least square:

None


Probabilities that GCOS criteria is met:

Weighted least square:

None %

Ordinary least square:

None %


DHR statistics

Temporal stability [1/decade]:


abs

rel


Weighted least square:

None


Ordinary least square:

None


Probabilities that GCOS criteria is met:

Weighted least square:

None %

Ordinary least square:

None %


+057/+063 deg (BHR)


BHR statistics

Temporal stability [1/decade]:


abs

rel


Weighted least square:

0.0143902825775


Ordinary least square:

-0.00679631413783


Probabilities that GCOS criteria is met:

Weighted least square:

0.0 %

Ordinary least square:

4.9 %


DHR statistics

Temporal stability [1/decade]:


abs

rel


Weighted least square:

0.0161746096165


Ordinary least square:

-0.00718996766659


Probabilities that GCOS criteria is met:

Weighted least square:

0.0 %

Ordinary least square:

4.9 %


Temporal anomaly analyis

The variance of the temporal anomalies provides an additional measure about the stability of the signal AFTER removal of the mean seasonal cylce.

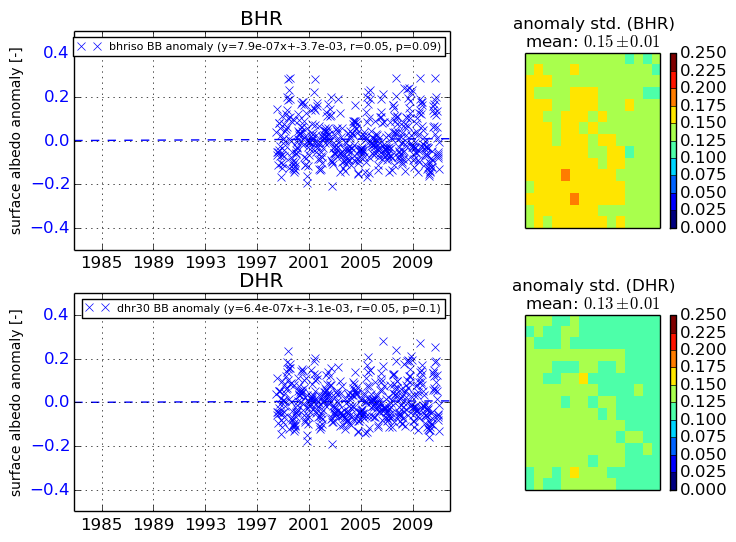
+000 deg


+057/+063 deg