BELMANIP_00314


Location

lon / lat [deg]: 97.4574 / 18.6124

Source network: BELMANIP


Geostationary surface albedo (GSA) data


“+000”


“+057/+063”


Landcover information (based on ESA CCI landcover data)


Landcover fractions @ 2km distance


Landcover fractions @ 20 km distance


Legend


Distance to open water bodies [km]:

13.06

Distance to urban areas [km]:

11.83


Radius: 1 km

Number of landcover classes:

3

Dominant landcover type:

40: mosaic natural vegetation (tree, shrub, herbaceous cover) (>50%) / cropland (<50%)

Fraction of dominant landcover type [%]:

69.0


Radius: 2 km

Number of landcover classes:

4

Dominant landcover type:

40: mosaic natural vegetation (tree, shrub, herbaceous cover) (>50%) / cropland (<50%)

Fraction of dominant landcover type [%]:

48.0


Radius: 5 km

Number of landcover classes:

4

Dominant landcover type:

61: Tree cover, broadleaved, decidous (closed > 40%)

Fraction of dominant landcover type [%]:

34.0


Radius: 10 km

Number of landcover classes:

6

Dominant landcover type:

40: mosaic natural vegetation (tree, shrub, herbaceous cover) (>50%) / cropland (<50%)

Fraction of dominant landcover type [%]:

27.0


Radius: 20 km

Number of landcover classes:

7

Dominant landcover type:

60: Tree cover, broadleaved, decidous

Fraction of dominant landcover type [%]:

25.0


Disturbances


Heterogeneity analysis

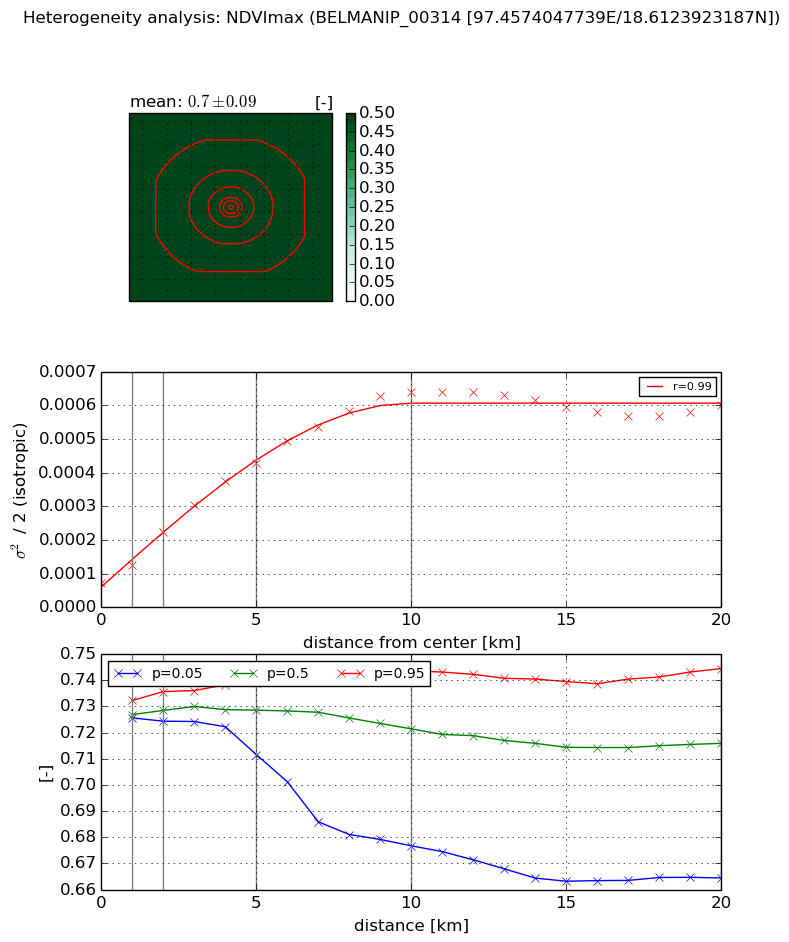
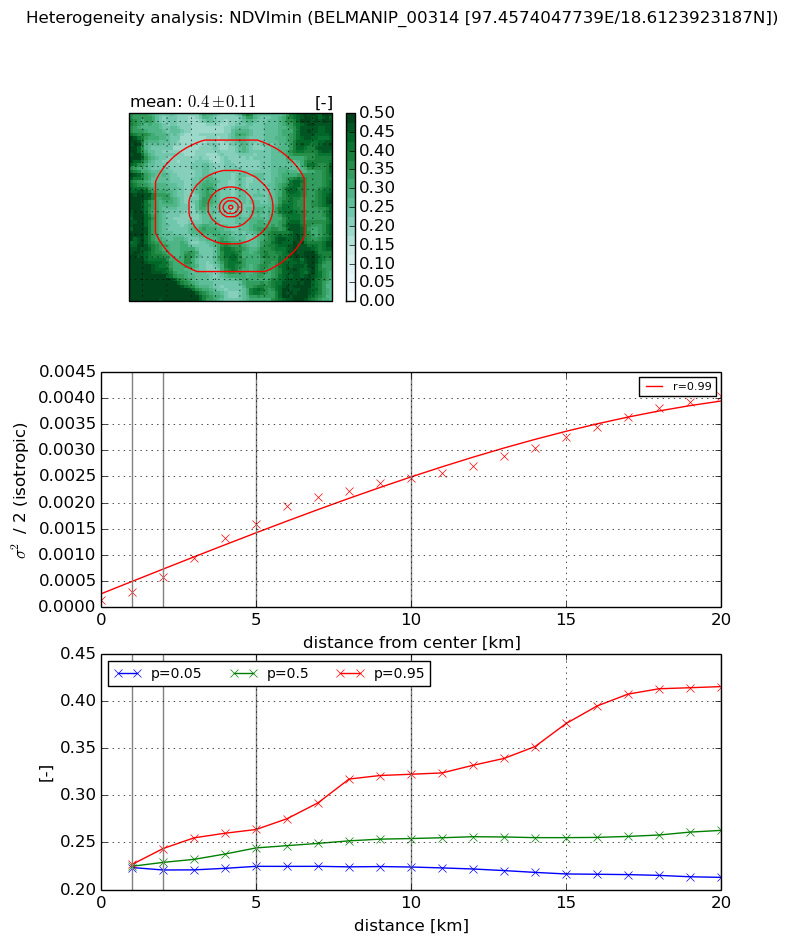
The heterogeneity analysis provides information about the spatial and temporal heterogeneity of the site.

Topography


Roman et al. (2009) index


St

0.0929108575861

Rcv

0.878188300494

Rse

0.0

Rst

4.97429872945e-06

Rsv

31.4108209259


Height range @ 1km [m]

51

Height range @ 2km [m]

102

Height range @ 5km [m]

338

Height range @ 10km [m]

-999

Height range @ 20km [m]

-999


Variance slope @ 1 km

1730

Variance slope @ 2 km

1914

Variance slope @ 5 km

2469

Variance slope @ 10 km

-999

Variance slope @ 20 km

-999


NDVI (max. NDVI composite)


Roman et al. (2009) index


St

nan

Rcv

1.28356020023

Rse

nan

Rst

nan

Rsv

19.9355552769


NDVI range @ 1km [-]

0.01

NDVI range @ 2km [-]

0.01

NDVI range @ 5km [-]

0.03

NDVI range @ 10km [-]

0.07

NDVI range @ 20km [-]

0.08


Variance slope @ 1 km

5.35964512747e-05

Variance slope @ 2 km

7.50697470164e-05

Variance slope @ 5 km

7.46413710998e-05

Variance slope @ 10 km

5.89612100308e-05

Variance slope @ 20 km

2.19775979405e-05


NDVI (min. NDVI composite)I


Roman et al. (2009) index


St

nan

Rcv

nan

Rse

nan

Rst

nan

Rsv

nan


NDVI range @ 1km [-]

0.0

NDVI range @ 2km [-]

0.02

NDVI range @ 5km [-]

0.04

NDVI range @ 10km [-]

0.1

NDVI range @ 20km [-]

0.2


NDVI slope @ 1 km

0.000146919746385

NDVI slope @ 2 km

0.000218286973395

NDVI slope @ 5 km

0.000306177937623

NDVI slope @ 10 km

0.000253348373005

NDVI slope @ 20 km

0.000188781715757


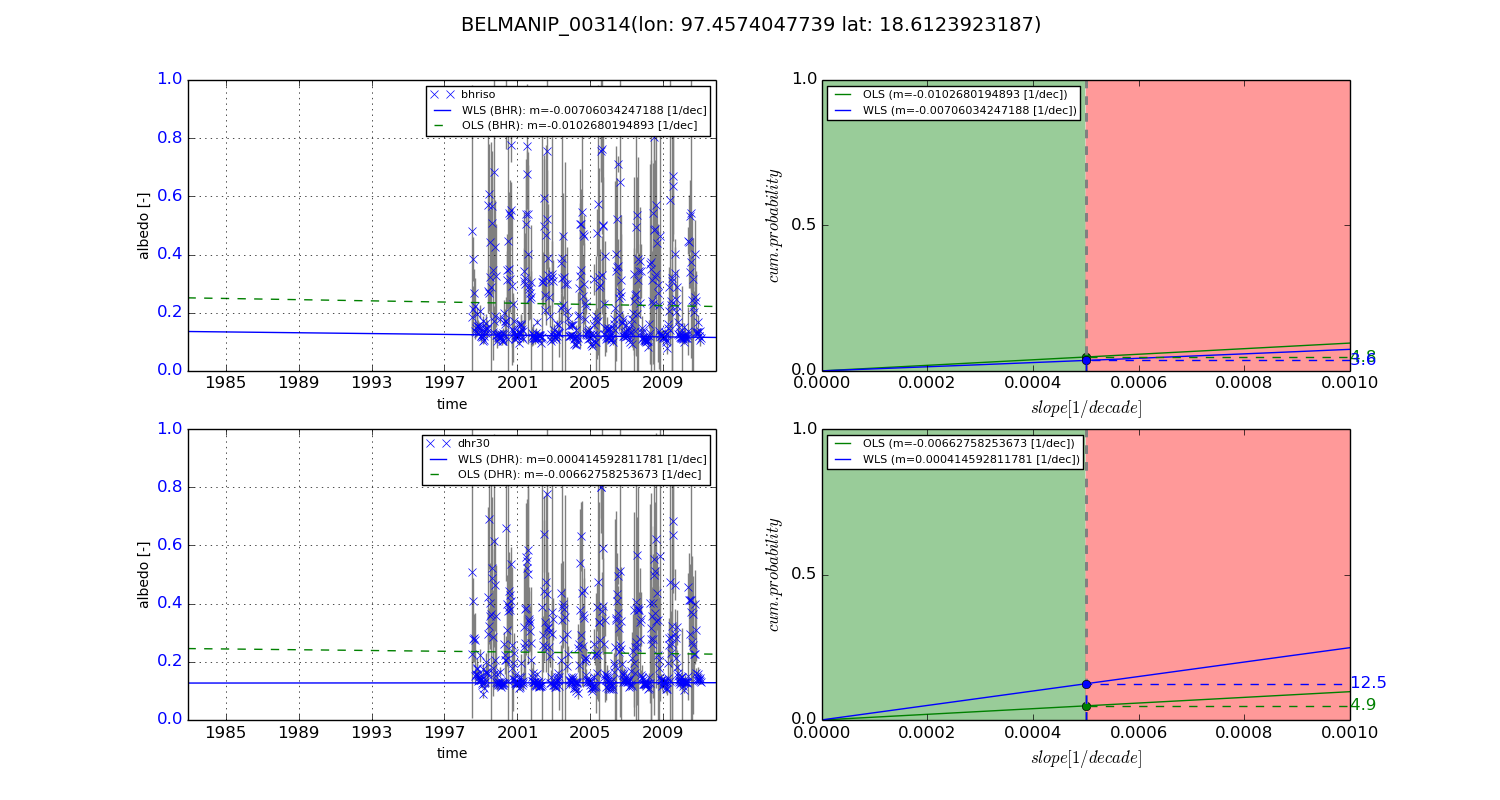
Temporal stability analysis

+000 deg (BHR)


BHR statistics

Temporal stability [1/decade]:


abs

rel


Weighted least square:

None


Ordinary least square:

None


Probabilities that GCOS criteria is met:

Weighted least square:

None %

Ordinary least square:

None %


DHR statistics

Temporal stability [1/decade]:


abs

rel


Weighted least square:

None


Ordinary least square:

None


Probabilities that GCOS criteria is met:

Weighted least square:

None %

Ordinary least square:

None %


+057/+063 deg (BHR)


BHR statistics

Temporal stability [1/decade]:


abs

rel


Weighted least square:

-0.00706034247188


Ordinary least square:

-0.0102680194893


Probabilities that GCOS criteria is met:

Weighted least square:

3.6 %

Ordinary least square:

4.8 %


DHR statistics

Temporal stability [1/decade]:


abs

rel


Weighted least square:

0.000414592811781


Ordinary least square:

-0.00662758253673


Probabilities that GCOS criteria is met:

Weighted least square:

12.5 %

Ordinary least square:

4.9 %


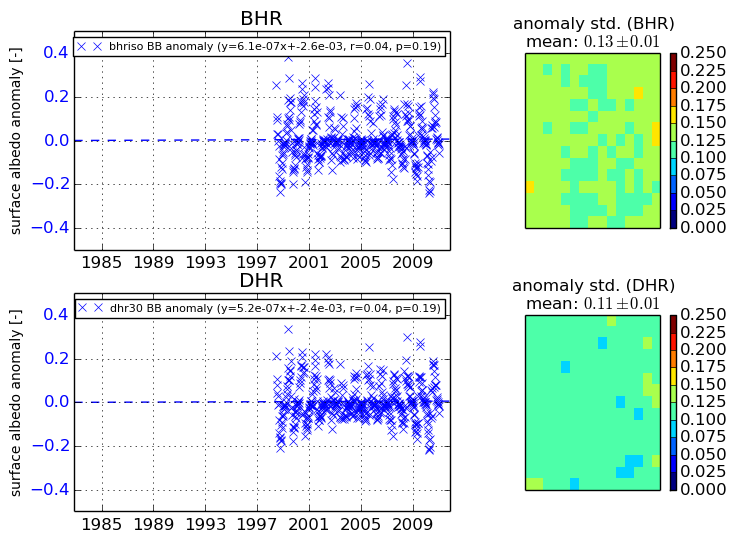
Temporal anomaly analyis

The variance of the temporal anomalies provides an additional measure about the stability of the signal AFTER removal of the mean seasonal cylce.

+000 deg


+057/+063 deg