BELMANIP_00319


Location

lon / lat [deg]: 96.046 / 26.0473

Source network: BELMANIP


Geostationary surface albedo (GSA) data


“+000”


“+057/+063”


Landcover information (based on ESA CCI landcover data)


Landcover fractions @ 2km distance


Landcover fractions @ 20 km distance


Legend


Distance to open water bodies [km]:

17.03

Distance to urban areas [km]:

17.77


Radius: 1 km

Number of landcover classes:

1

Dominant landcover type:

50: Tree cover, broadleaved, evergreen, closed to open (>15%)

Fraction of dominant landcover type [%]:

100.0


Radius: 2 km

Number of landcover classes:

1

Dominant landcover type:

50: Tree cover, broadleaved, evergreen, closed to open (>15%)

Fraction of dominant landcover type [%]:

100.0


Radius: 5 km

Number of landcover classes:

2

Dominant landcover type:

50: Tree cover, broadleaved, evergreen, closed to open (>15%)

Fraction of dominant landcover type [%]:

99.0


Radius: 10 km

Number of landcover classes:

2

Dominant landcover type:

50: Tree cover, broadleaved, evergreen, closed to open (>15%)

Fraction of dominant landcover type [%]:

97.0


Radius: 20 km

Number of landcover classes:

3

Dominant landcover type:

50: Tree cover, broadleaved, evergreen, closed to open (>15%)

Fraction of dominant landcover type [%]:

91.0


Disturbances


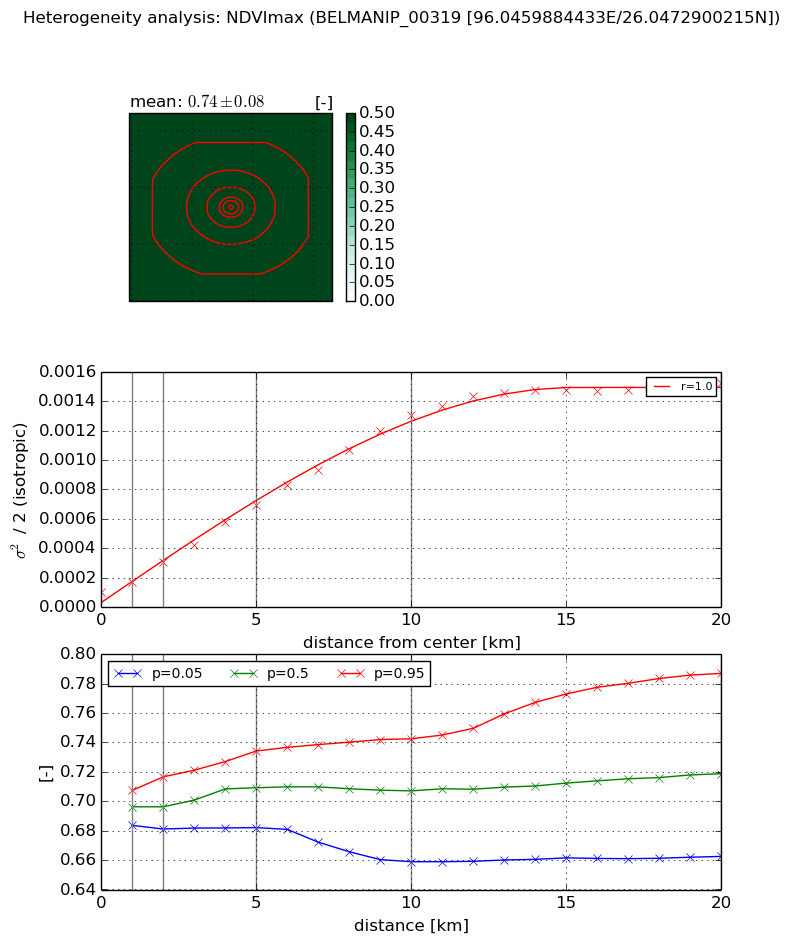
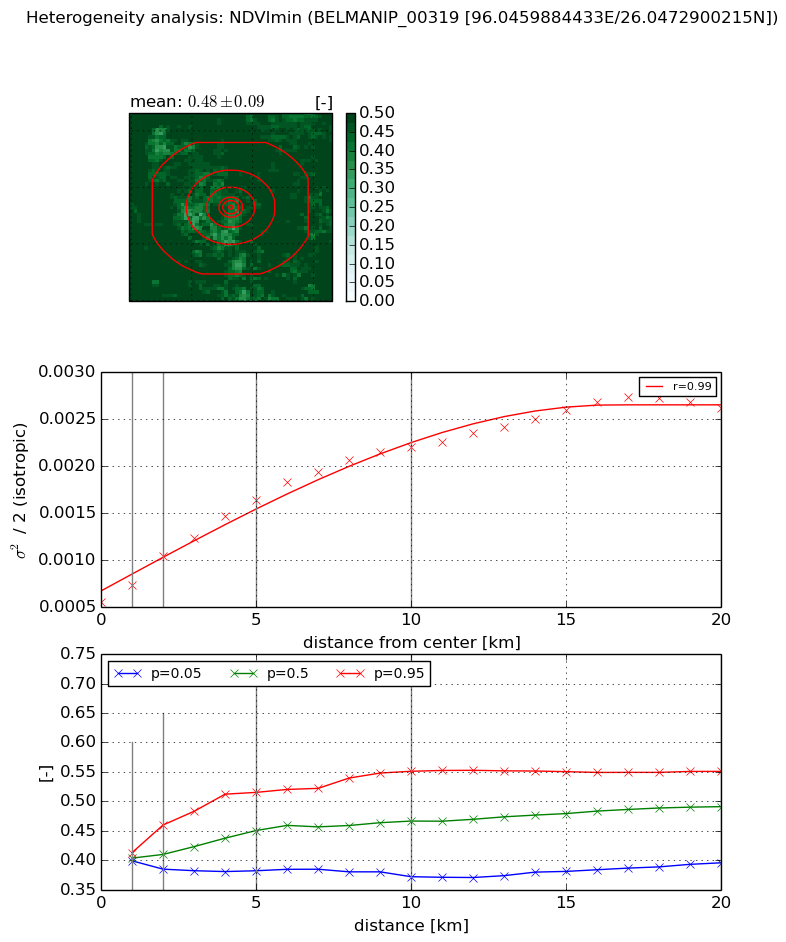
Heterogeneity analysis

The heterogeneity analysis provides information about the spatial and temporal heterogeneity of the site.

Topography


Roman et al. (2009) index


St

0.000405640335623

Rcv

0.146436339219

Rse

0.0

Rst

-0.0383225828215

Rsv

7395.52946509


Height range @ 1km [m]

322

Height range @ 2km [m]

616

Height range @ 5km [m]

799

Height range @ 10km [m]

-999

Height range @ 20km [m]

-999


Variance slope @ 1 km

21479

Variance slope @ 2 km

21117

Variance slope @ 5 km

13780

Variance slope @ 10 km

-999

Variance slope @ 20 km

-999


NDVI (max. NDVI composite)


Roman et al. (2009) index


St

2.32640612473

Rcv

0.263097008628

Rse

0.0

Rst

-0.0264458566145

Rsv

-0.999999819549


NDVI range @ 1km [-]

0.02

NDVI range @ 2km [-]

0.04

NDVI range @ 5km [-]

0.05

NDVI range @ 10km [-]

0.08

NDVI range @ 20km [-]

0.12


Variance slope @ 1 km

6.89360277029e-05

Variance slope @ 2 km

0.000104320468157

Variance slope @ 5 km

0.000123735109552

Variance slope @ 10 km

0.000124477668806

Variance slope @ 20 km

7.43506539562e-05


NDVI (min. NDVI composite)I


Roman et al. (2009) index


St

nan

Rcv

nan

Rse

nan

Rst

nan

Rsv

nan


NDVI range @ 1km [-]

0.01

NDVI range @ 2km [-]

0.08

NDVI range @ 5km [-]

0.13

NDVI range @ 10km [-]

0.18

NDVI range @ 20km [-]

0.16


NDVI slope @ 1 km

0.000171153410686

NDVI slope @ 2 km

0.000243323874241

NDVI slope @ 5 km

0.000223690802876

NDVI slope @ 10 km

0.000169474858628

NDVI slope @ 20 km

0.000102330872122


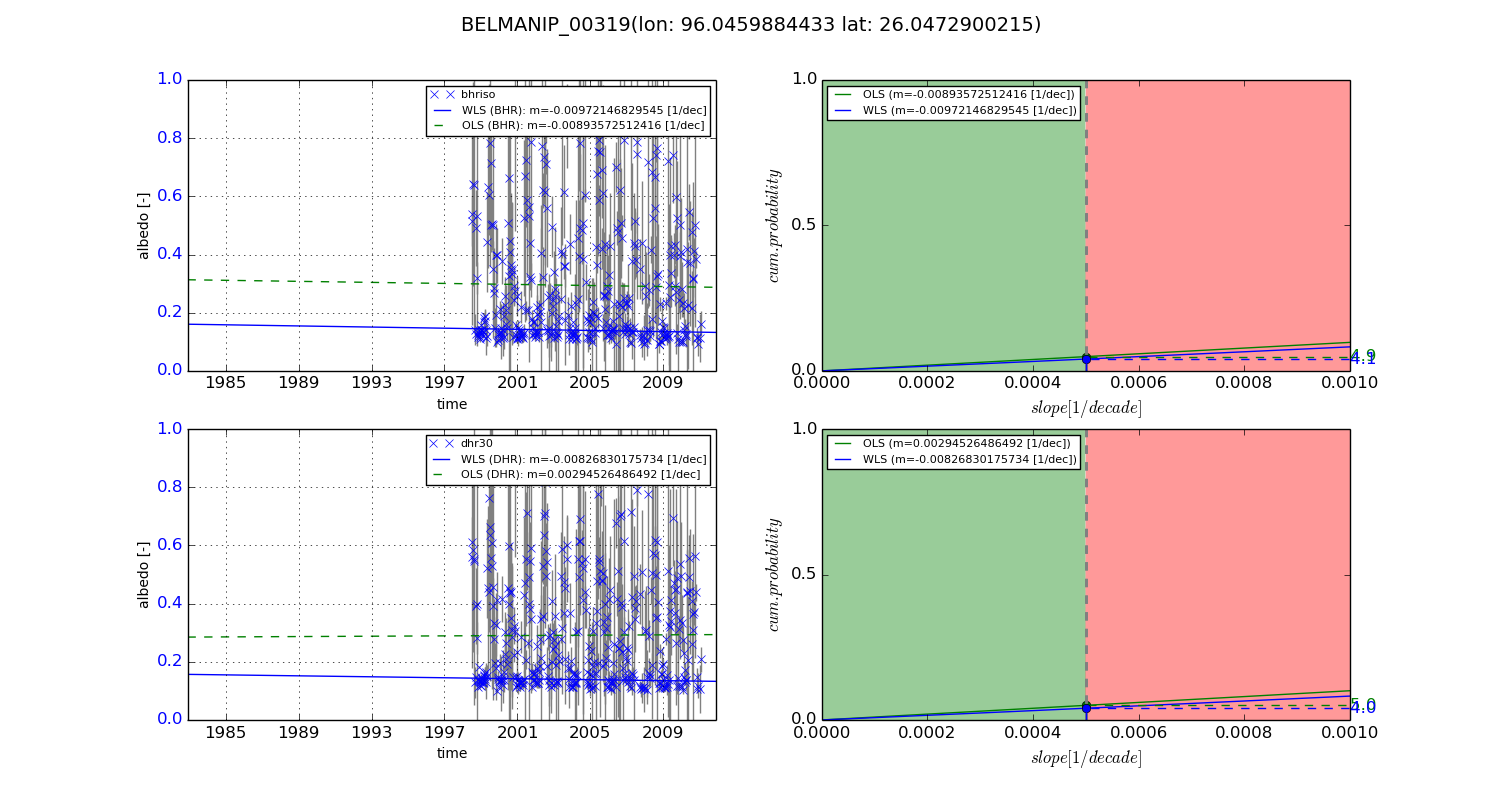
Temporal stability analysis

+000 deg (BHR)


BHR statistics

Temporal stability [1/decade]:


abs

rel


Weighted least square:

None


Ordinary least square:

None


Probabilities that GCOS criteria is met:

Weighted least square:

None %

Ordinary least square:

None %


DHR statistics

Temporal stability [1/decade]:


abs

rel


Weighted least square:

None


Ordinary least square:

None


Probabilities that GCOS criteria is met:

Weighted least square:

None %

Ordinary least square:

None %


+057/+063 deg (BHR)


BHR statistics

Temporal stability [1/decade]:


abs

rel


Weighted least square:

-0.00972146829545


Ordinary least square:

-0.00893572512416


Probabilities that GCOS criteria is met:

Weighted least square:

4.1 %

Ordinary least square:

4.9 %


DHR statistics

Temporal stability [1/decade]:


abs

rel


Weighted least square:

-0.00826830175734


Ordinary least square:

0.00294526486492


Probabilities that GCOS criteria is met:

Weighted least square:

4.0 %

Ordinary least square:

5.0 %


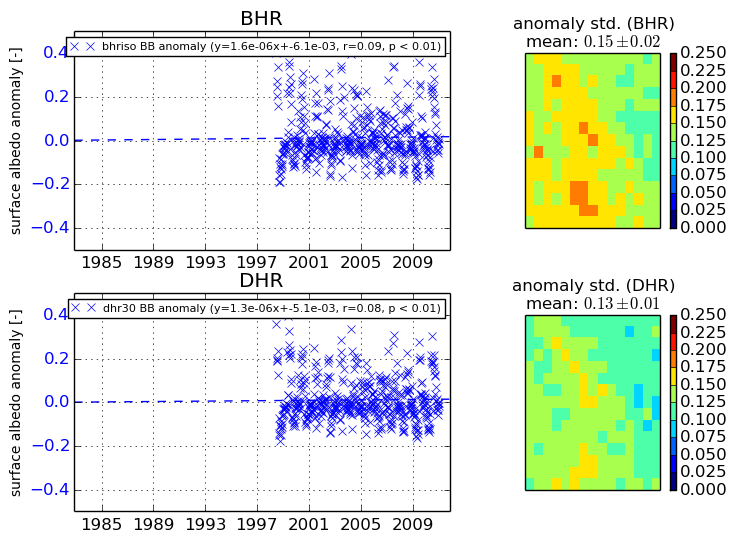
Temporal anomaly analyis

The variance of the temporal anomalies provides an additional measure about the stability of the signal AFTER removal of the mean seasonal cylce.

+000 deg


+057/+063 deg


By continuing to use this website, you are giving consent to analytic cookies being used. For more information on how EUMETSAT uses data and how you can disable this, please view this web page: Analytics Cookie Policy