BELMANIP_00321


Location

lon / lat [deg]: 81.8757 / 22.493

Source network: BELMANIP


Geostationary surface albedo (GSA) data


“+000”


“+057/+063”


Landcover information (based on ESA CCI landcover data)


Landcover fractions @ 2km distance


Landcover fractions @ 20 km distance


Legend


Distance to open water bodies [km]:

21.06

Distance to urban areas [km]:

26.86


Radius: 1 km

Number of landcover classes:

2

Dominant landcover type:

61: Tree cover, broadleaved, decidous (closed > 40%)

Fraction of dominant landcover type [%]:

57.0


Radius: 2 km

Number of landcover classes:

4

Dominant landcover type:

61: Tree cover, broadleaved, decidous (closed > 40%)

Fraction of dominant landcover type [%]:

66.0


Radius: 5 km

Number of landcover classes:

6

Dominant landcover type:

61: Tree cover, broadleaved, decidous (closed > 40%)

Fraction of dominant landcover type [%]:

69.0


Radius: 10 km

Number of landcover classes:

6

Dominant landcover type:

61: Tree cover, broadleaved, decidous (closed > 40%)

Fraction of dominant landcover type [%]:

60.0


Radius: 20 km

Number of landcover classes:

6

Dominant landcover type:

61: Tree cover, broadleaved, decidous (closed > 40%)

Fraction of dominant landcover type [%]:

46.0


Disturbances


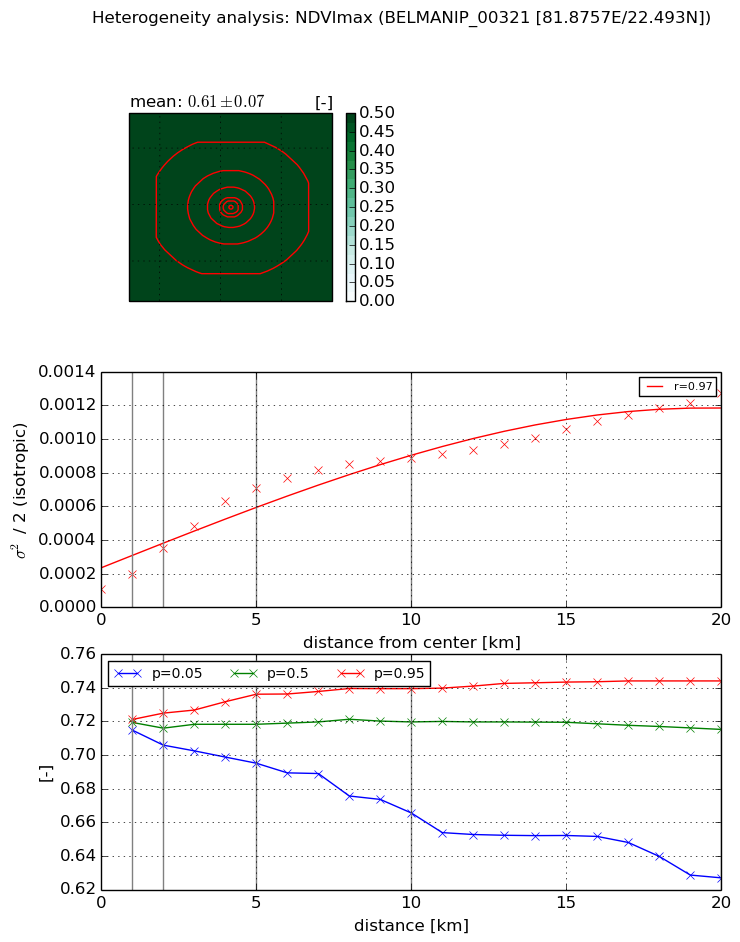
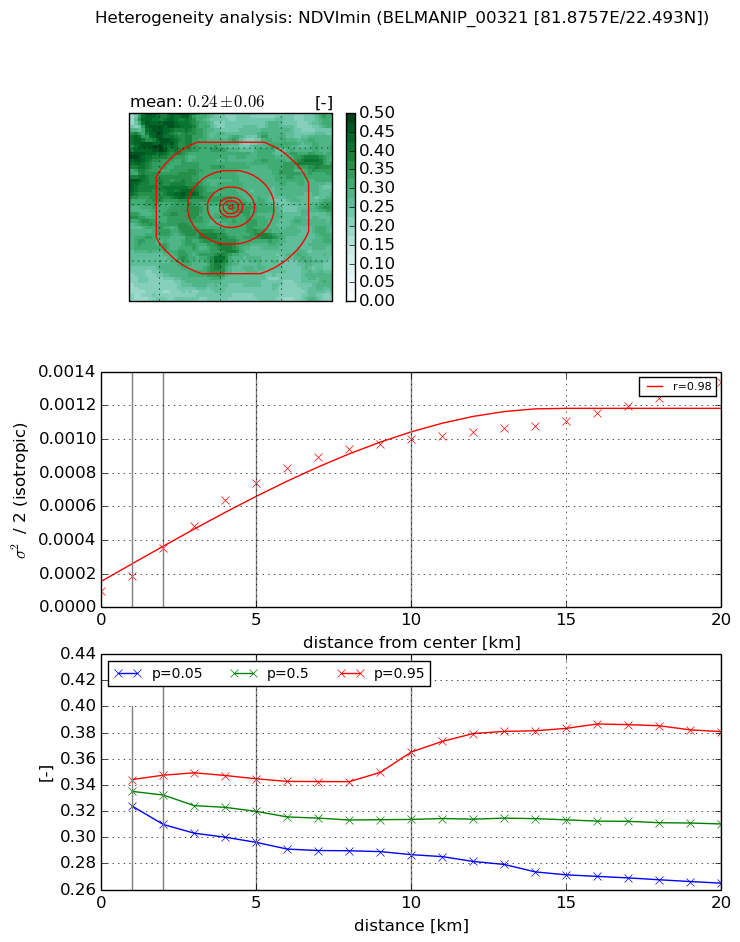
Heterogeneity analysis

The heterogeneity analysis provides information about the spatial and temporal heterogeneity of the site.

Topography


Roman et al. (2009) index


St

0.000797173433033

Rcv

0.676083206575

Rse

0.0

Rst

-0.0157960084694

Rsv

3762.6046328


Height range @ 1km [m]

45

Height range @ 2km [m]

67

Height range @ 5km [m]

140

Height range @ 10km [m]

-999

Height range @ 20km [m]

-999


Variance slope @ 1 km

649

Variance slope @ 2 km

632

Variance slope @ 5 km

553

Variance slope @ 10 km

-999

Variance slope @ 20 km

-999


NDVI (max. NDVI composite)


Roman et al. (2009) index


St

2.17557832885

Rcv

0.689466699243

Rse

0.0

Rst

-0.0834233613712

Rsv

0.606053625402


NDVI range @ 1km [-]

0.01

NDVI range @ 2km [-]

0.02

NDVI range @ 5km [-]

0.04

NDVI range @ 10km [-]

0.07

NDVI range @ 20km [-]

0.12


Variance slope @ 1 km

8.9998204692e-05

Variance slope @ 2 km

0.000124069350109

Variance slope @ 5 km

0.000126867845122

Variance slope @ 10 km

8.09578296346e-05

Variance slope @ 20 km

4.97620849122e-05


NDVI (min. NDVI composite)I


Roman et al. (2009) index


St

14.4709820471

Rcv

0.0709395608105

Rse

0.0

Rst

0.123664070581

Rsv

-0.0127077998749


NDVI range @ 1km [-]

0.02

NDVI range @ 2km [-]

0.04

NDVI range @ 5km [-]

0.05

NDVI range @ 10km [-]

0.08

NDVI range @ 20km [-]

0.12


NDVI slope @ 1 km

8.72987753027e-05

NDVI slope @ 2 km

0.000126866562328

NDVI slope @ 5 km

0.000134569541524

NDVI slope @ 10 km

9.4943621122e-05

NDVI slope @ 20 km

5.35570546283e-05


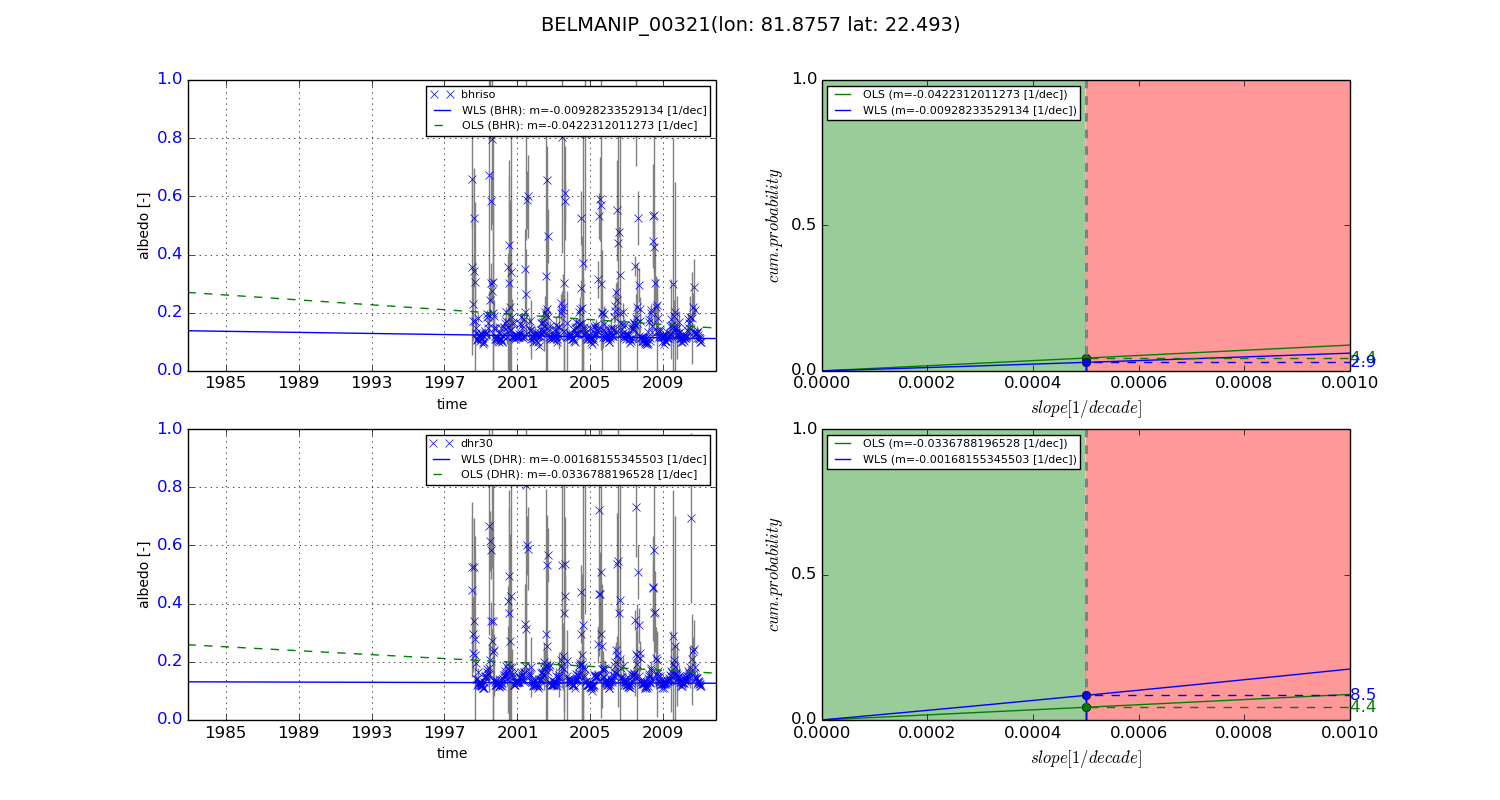
Temporal stability analysis

+000 deg (BHR)


BHR statistics

Temporal stability [1/decade]:


abs

rel


Weighted least square:

None


Ordinary least square:

None


Probabilities that GCOS criteria is met:

Weighted least square:

None %

Ordinary least square:

None %


DHR statistics

Temporal stability [1/decade]:


abs

rel


Weighted least square:

None


Ordinary least square:

None


Probabilities that GCOS criteria is met:

Weighted least square:

None %

Ordinary least square:

None %


+057/+063 deg (BHR)


BHR statistics

Temporal stability [1/decade]:


abs

rel


Weighted least square:

-0.00928233529134


Ordinary least square:

-0.0422312011273


Probabilities that GCOS criteria is met:

Weighted least square:

2.9 %

Ordinary least square:

4.4 %


DHR statistics

Temporal stability [1/decade]:


abs

rel


Weighted least square:

-0.00168155345503


Ordinary least square:

-0.0336788196528


Probabilities that GCOS criteria is met:

Weighted least square:

8.5 %

Ordinary least square:

4.4 %


Temporal anomaly analyis

The variance of the temporal anomalies provides an additional measure about the stability of the signal AFTER removal of the mean seasonal cylce.

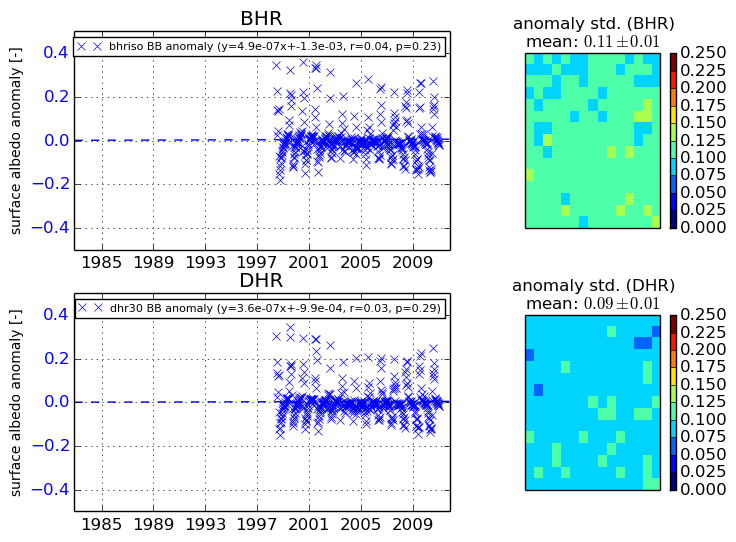
+000 deg


+057/+063 deg