BELMANIP_00323


Location

lon / lat [deg]: 100.3811 / 27.9921

Source network: BELMANIP


Geostationary surface albedo (GSA) data


“+000”


“+057/+063”


Landcover information (based on ESA CCI landcover data)


Landcover fractions @ 2km distance


Landcover fractions @ 20 km distance


Legend


Distance to open water bodies [km]:

9.01

Distance to urban areas [km]:

12.92


Radius: 1 km

Number of landcover classes:

4

Dominant landcover type:

70: Tree cover, needleleaved, evergreen, closed to open (>15%)

Fraction of dominant landcover type [%]:

80.0


Radius: 2 km

Number of landcover classes:

7

Dominant landcover type:

70: Tree cover, needleleaved, evergreen, closed to open (>15%)

Fraction of dominant landcover type [%]:

68.0


Radius: 5 km

Number of landcover classes:

8

Dominant landcover type:

70: Tree cover, needleleaved, evergreen, closed to open (>15%)

Fraction of dominant landcover type [%]:

64.0


Radius: 10 km

Number of landcover classes:

8

Dominant landcover type:

70: Tree cover, needleleaved, evergreen, closed to open (>15%)

Fraction of dominant landcover type [%]:

63.0


Radius: 20 km

Number of landcover classes:

10

Dominant landcover type:

70: Tree cover, needleleaved, evergreen, closed to open (>15%)

Fraction of dominant landcover type [%]:

64.0


Disturbances


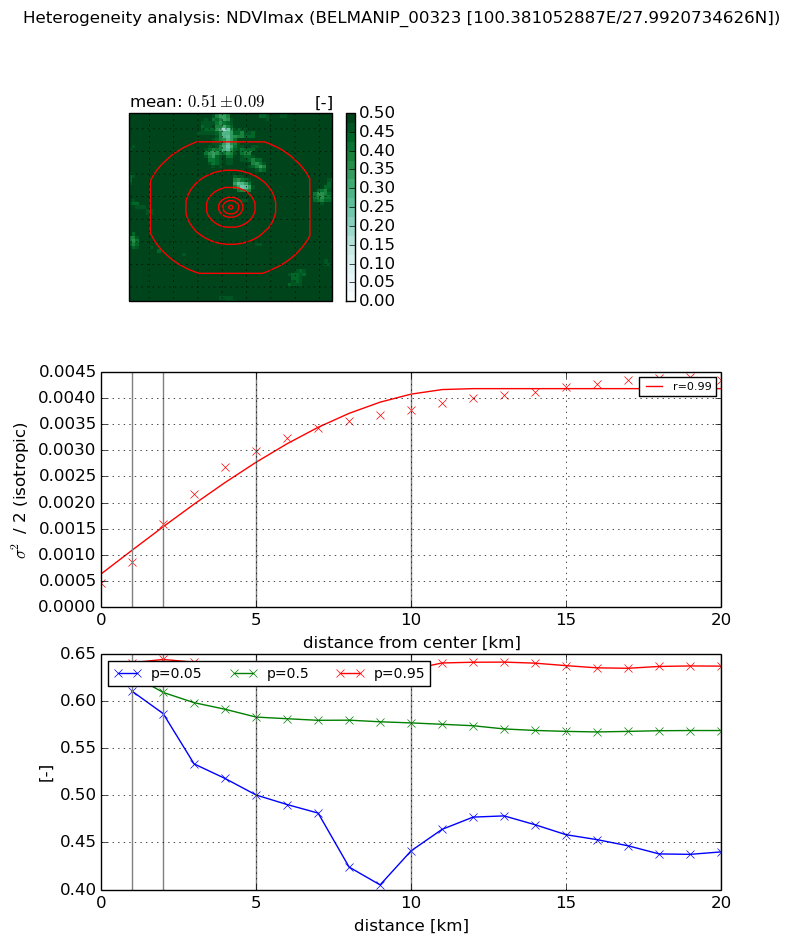
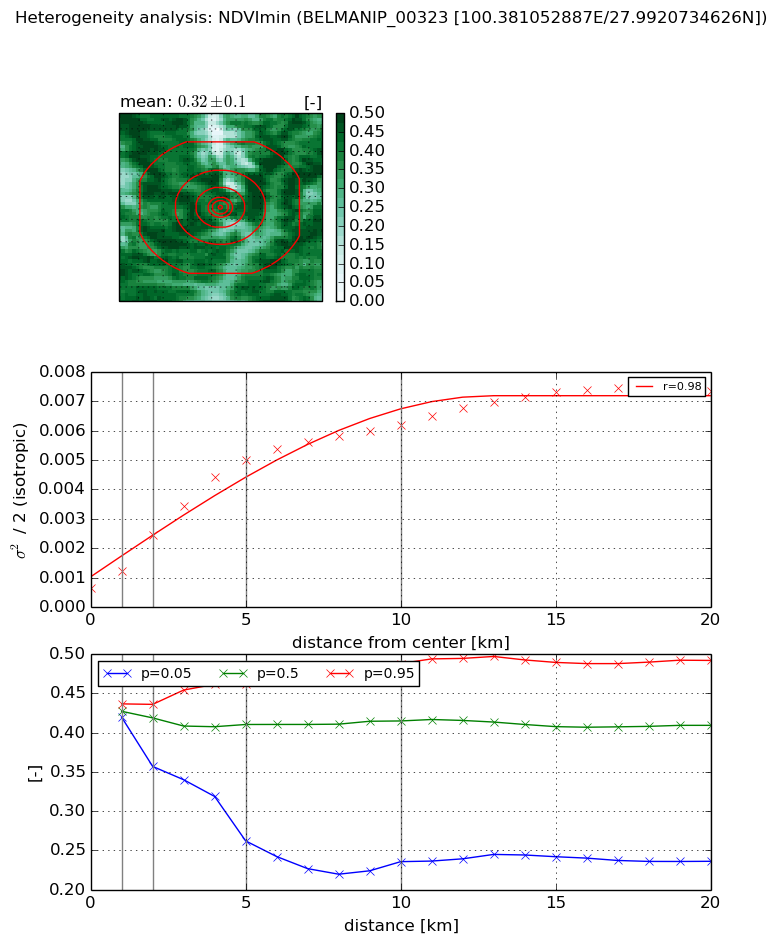
Heterogeneity analysis

The heterogeneity analysis provides information about the spatial and temporal heterogeneity of the site.

Topography


Roman et al. (2009) index


St

43.5879815684

Rcv

-0.0206519777778

Rse

0.0

Rst

-0.0463782436543

Rsv

-0.00179609013483


Height range @ 1km [m]

915

Height range @ 2km [m]

1739

Height range @ 5km [m]

1905

Height range @ 10km [m]

-999

Height range @ 20km [m]

-999


Variance slope @ 1 km

68465

Variance slope @ 2 km

89771

Variance slope @ 5 km

89768

Variance slope @ 10 km

-999

Variance slope @ 20 km

-999


NDVI (max. NDVI composite)


Roman et al. (2009) index


St

8.21418344256e-07

Rcv

0.178698392936

Rse

0.0

Rst

0.569701742797

Rsv

3652218.63649


NDVI range @ 1km [-]

0.03

NDVI range @ 2km [-]

0.06

NDVI range @ 5km [-]

0.13

NDVI range @ 10km [-]

0.19

NDVI range @ 20km [-]

0.2


Variance slope @ 1 km

0.00038608744859

Variance slope @ 2 km

0.000558849013181

Variance slope @ 5 km

0.000532288958603

Variance slope @ 10 km

0.000334011803493

Variance slope @ 20 km

0.000169620286187


NDVI (min. NDVI composite)I


Roman et al. (2009) index


St

1.89025482547

Rcv

0.509216006678

Rse

0.0

Rst

-0.0778717992819

Rsv

-0.99999979703


NDVI range @ 1km [-]

0.02

NDVI range @ 2km [-]

0.08

NDVI range @ 5km [-]

0.2

NDVI range @ 10km [-]

0.25

NDVI range @ 20km [-]

0.26


NDVI slope @ 1 km

0.000592208631855

NDVI slope @ 2 km

0.000905146876786

NDVI slope @ 5 km

0.00092081467232

NDVI slope @ 10 km

0.000564837762106

NDVI slope @ 20 km

0.000302882620888


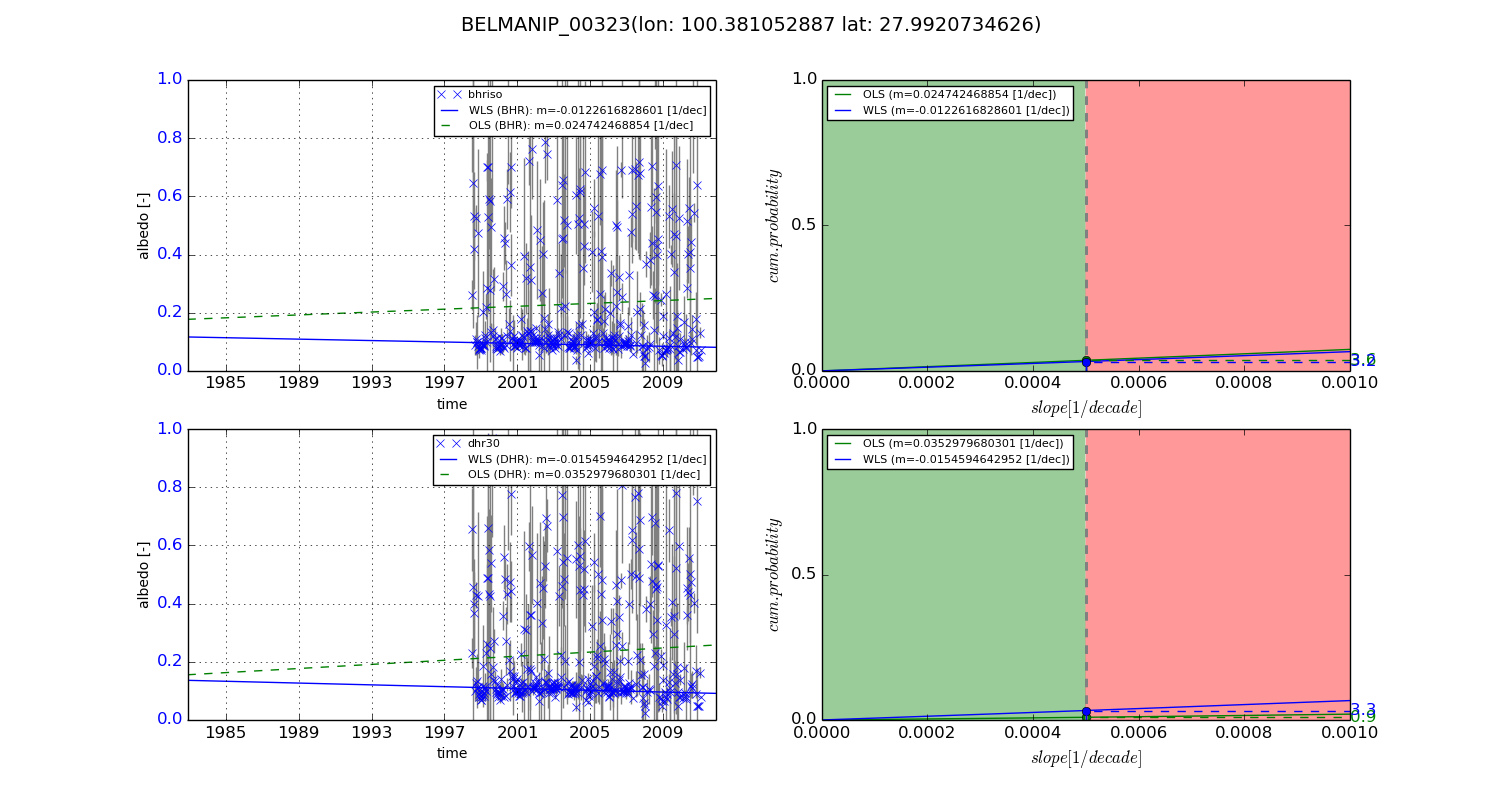
Temporal stability analysis

+000 deg (BHR)


BHR statistics

Temporal stability [1/decade]:


abs

rel


Weighted least square:

None


Ordinary least square:

None


Probabilities that GCOS criteria is met:

Weighted least square:

None %

Ordinary least square:

None %


DHR statistics

Temporal stability [1/decade]:


abs

rel


Weighted least square:

None


Ordinary least square:

None


Probabilities that GCOS criteria is met:

Weighted least square:

None %

Ordinary least square:

None %


+057/+063 deg (BHR)


BHR statistics

Temporal stability [1/decade]:


abs

rel


Weighted least square:

-0.0122616828601


Ordinary least square:

0.024742468854


Probabilities that GCOS criteria is met:

Weighted least square:

3.2 %

Ordinary least square:

3.6 %


DHR statistics

Temporal stability [1/decade]:


abs

rel


Weighted least square:

-0.0154594642952


Ordinary least square:

0.0352979680301


Probabilities that GCOS criteria is met:

Weighted least square:

3.3 %

Ordinary least square:

0.9 %


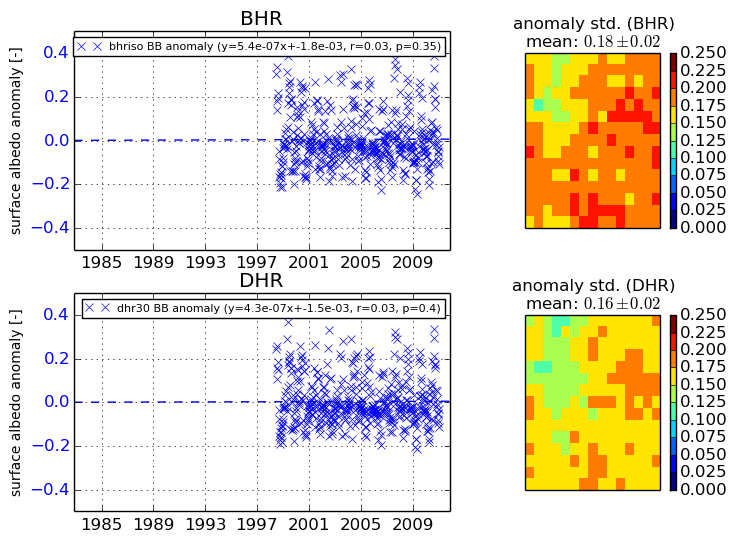
Temporal anomaly analyis

The variance of the temporal anomalies provides an additional measure about the stability of the signal AFTER removal of the mean seasonal cylce.

+000 deg


+057/+063 deg