BELMANIP_00324


Location

lon / lat [deg]: 105.4218 / 25.8461

Source network: BELMANIP


Geostationary surface albedo (GSA) data


“+000”


“+057/+063”


Landcover information (based on ESA CCI landcover data)


Landcover fractions @ 2km distance


Landcover fractions @ 20 km distance


Legend


Distance to open water bodies [km]:

11.14

Distance to urban areas [km]:

17.66


Radius: 1 km

Number of landcover classes:

3

Dominant landcover type:

10: cropland, rainfed

Fraction of dominant landcover type [%]:

55.0


Radius: 2 km

Number of landcover classes:

4

Dominant landcover type:

10: cropland, rainfed

Fraction of dominant landcover type [%]:

53.0


Radius: 5 km

Number of landcover classes:

6

Dominant landcover type:

10: cropland, rainfed

Fraction of dominant landcover type [%]:

59.0


Radius: 10 km

Number of landcover classes:

7

Dominant landcover type:

10: cropland, rainfed

Fraction of dominant landcover type [%]:

38.0


Radius: 20 km

Number of landcover classes:

7

Dominant landcover type:

70: Tree cover, needleleaved, evergreen, closed to open (>15%)

Fraction of dominant landcover type [%]:

32.0


Disturbances


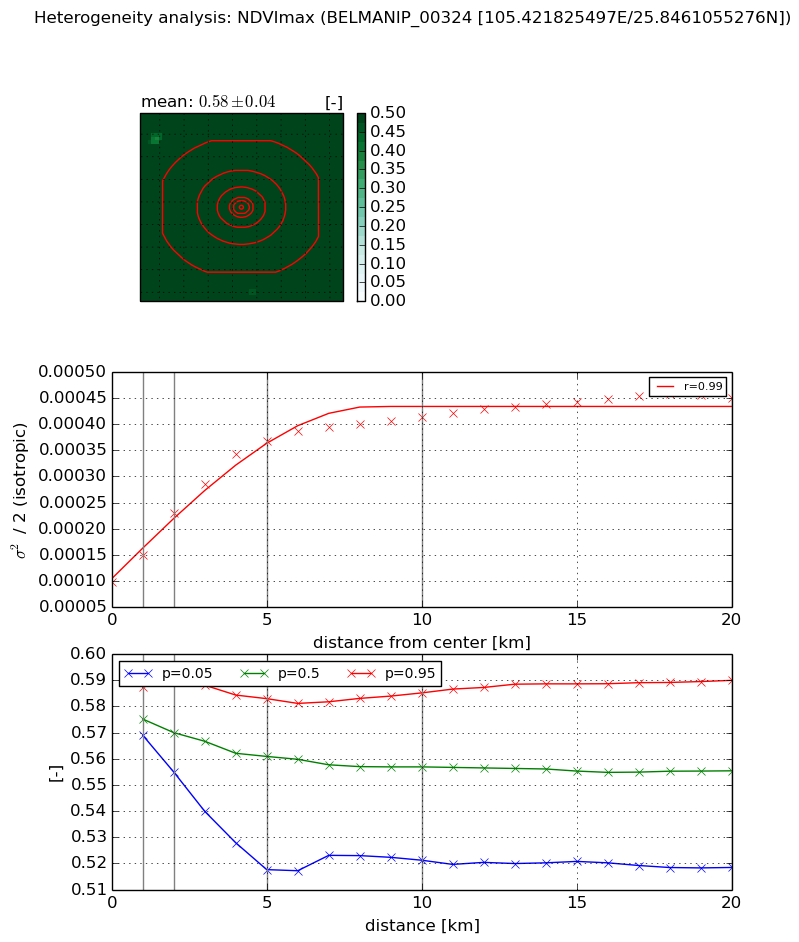
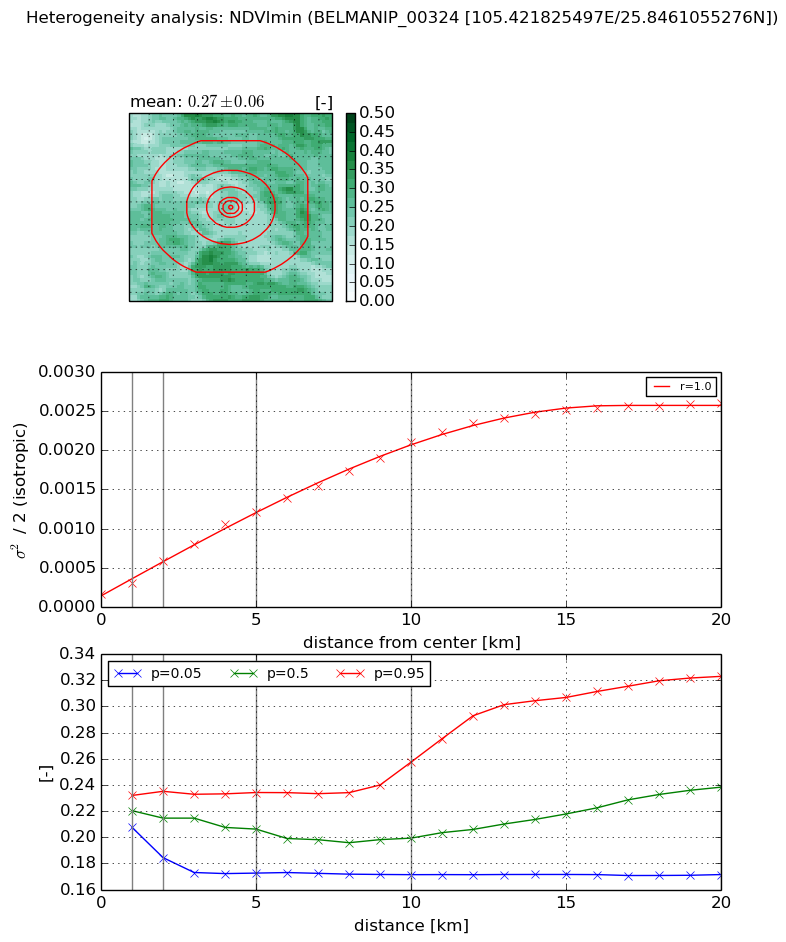
Heterogeneity analysis

The heterogeneity analysis provides information about the spatial and temporal heterogeneity of the site.

Topography


Roman et al. (2009) index


St

0.00613905024752

Rcv

0.470570854372

Rse

0.0

Rst

-0.0854701718887

Rsv

488.118897122


Height range @ 1km [m]

233

Height range @ 2km [m]

322

Height range @ 5km [m]

549

Height range @ 10km [m]

-999

Height range @ 20km [m]

-999


Variance slope @ 1 km

10410

Variance slope @ 2 km

8876

Variance slope @ 5 km

5457

Variance slope @ 10 km

-999

Variance slope @ 20 km

-999


NDVI (max. NDVI composite)


Roman et al. (2009) index


St

4.69978183582

Rcv

0.213177985392

Rse

0.0

Rst

0.0735603365942

Rsv

0.351589180183


NDVI range @ 1km [-]

0.02

NDVI range @ 2km [-]

0.04

NDVI range @ 5km [-]

0.07

NDVI range @ 10km [-]

0.06

NDVI range @ 20km [-]

0.07


Variance slope @ 1 km

5.07245558187e-05

Variance slope @ 2 km

6.5490929882e-05

Variance slope @ 5 km

5.65719073254e-05

Variance slope @ 10 km

3.07826619446e-05

Variance slope @ 20 km

1.38786803893e-05


NDVI (min. NDVI composite)I


Roman et al. (2009) index


St

4.51985273116

Rcv

0.0228691699518

Rse

0.0

Rst

-0.219658055191

Rsv

0.421211214678


NDVI range @ 1km [-]

0.02

NDVI range @ 2km [-]

0.05

NDVI range @ 5km [-]

0.06

NDVI range @ 10km [-]

0.09

NDVI range @ 20km [-]

0.15


NDVI slope @ 1 km

0.000149260072428

NDVI slope @ 2 km

0.000213158766375

NDVI slope @ 5 km

0.000219212358541

NDVI slope @ 10 km

0.000193666345335

NDVI slope @ 20 km

0.00012587709162


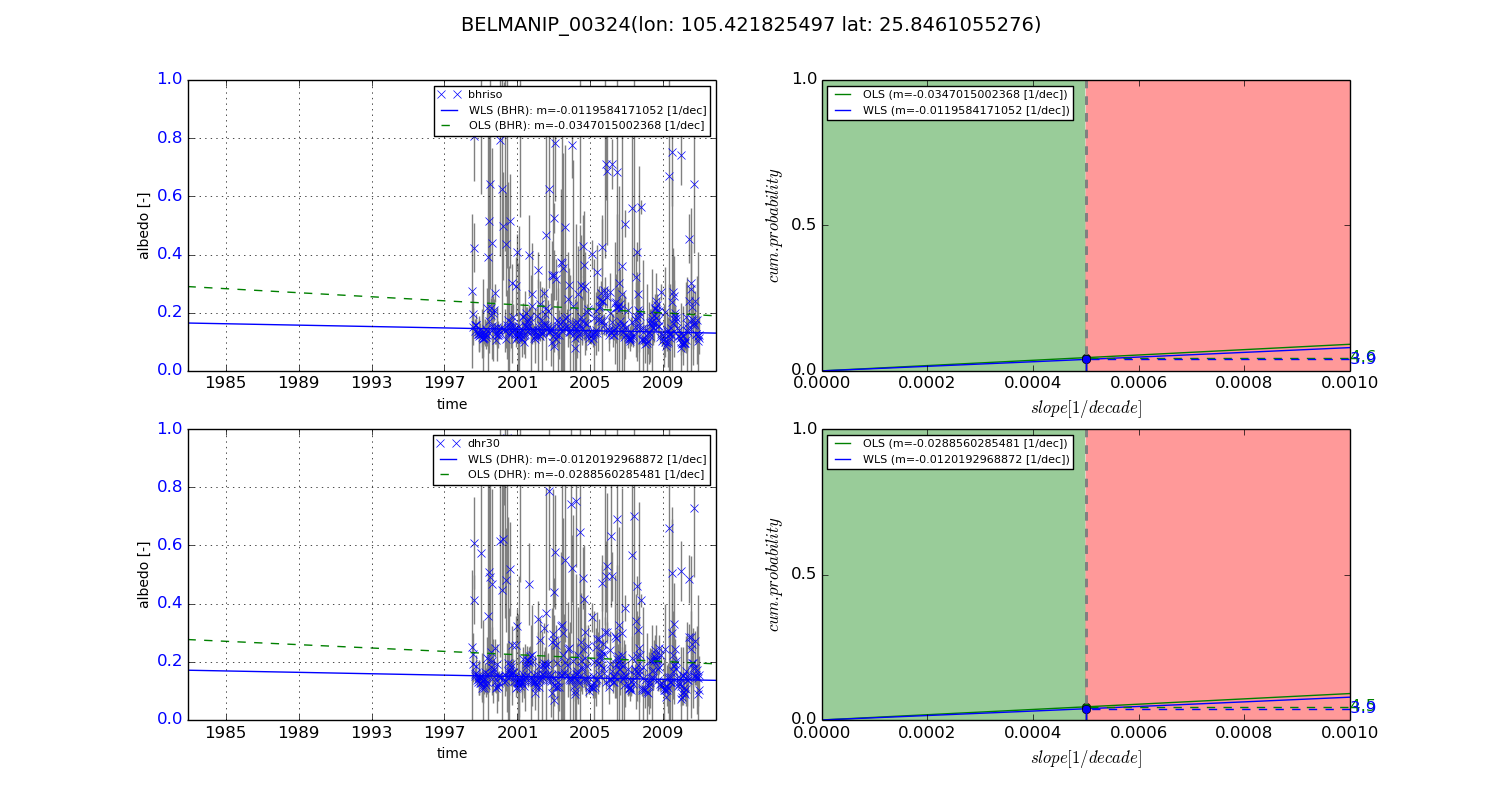
Temporal stability analysis

+000 deg (BHR)


BHR statistics

Temporal stability [1/decade]:


abs

rel


Weighted least square:

None


Ordinary least square:

None


Probabilities that GCOS criteria is met:

Weighted least square:

None %

Ordinary least square:

None %


DHR statistics

Temporal stability [1/decade]:


abs

rel


Weighted least square:

None


Ordinary least square:

None


Probabilities that GCOS criteria is met:

Weighted least square:

None %

Ordinary least square:

None %


+057/+063 deg (BHR)


BHR statistics

Temporal stability [1/decade]:


abs

rel


Weighted least square:

-0.0119584171052


Ordinary least square:

-0.0347015002368


Probabilities that GCOS criteria is met:

Weighted least square:

3.9 %

Ordinary least square:

4.6 %


DHR statistics

Temporal stability [1/decade]:


abs

rel


Weighted least square:

-0.0120192968872


Ordinary least square:

-0.0288560285481


Probabilities that GCOS criteria is met:

Weighted least square:

3.9 %

Ordinary least square:

4.5 %


Temporal anomaly analyis

The variance of the temporal anomalies provides an additional measure about the stability of the signal AFTER removal of the mean seasonal cylce.

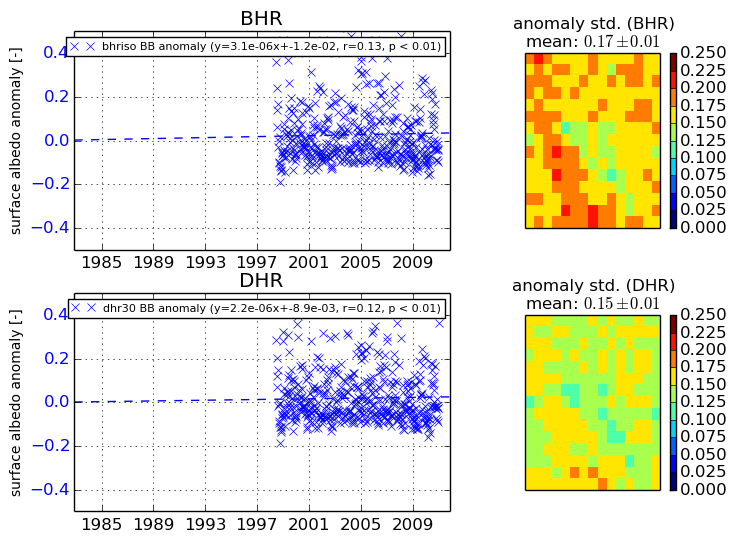
+000 deg


+057/+063 deg