BELMANIP_00325


Location

lon / lat [deg]: 117.4189 / 29.568

Source network: BELMANIP


Geostationary surface albedo (GSA) data


“+000”


“+057/+063”


Landcover information (based on ESA CCI landcover data)


Landcover fractions @ 2km distance


Landcover fractions @ 20 km distance


Legend


Distance to open water bodies [km]:

11.95

Distance to urban areas [km]:

10.18


Radius: 1 km

Number of landcover classes:

1

Dominant landcover type:

50: Tree cover, broadleaved, evergreen, closed to open (>15%)

Fraction of dominant landcover type [%]:

100.0


Radius: 2 km

Number of landcover classes:

2

Dominant landcover type:

50: Tree cover, broadleaved, evergreen, closed to open (>15%)

Fraction of dominant landcover type [%]:

98.0


Radius: 5 km

Number of landcover classes:

5

Dominant landcover type:

50: Tree cover, broadleaved, evergreen, closed to open (>15%)

Fraction of dominant landcover type [%]:

84.0


Radius: 10 km

Number of landcover classes:

6

Dominant landcover type:

50: Tree cover, broadleaved, evergreen, closed to open (>15%)

Fraction of dominant landcover type [%]:

68.0


Radius: 20 km

Number of landcover classes:

5

Dominant landcover type:

50: Tree cover, broadleaved, evergreen, closed to open (>15%)

Fraction of dominant landcover type [%]:

62.0


Disturbances


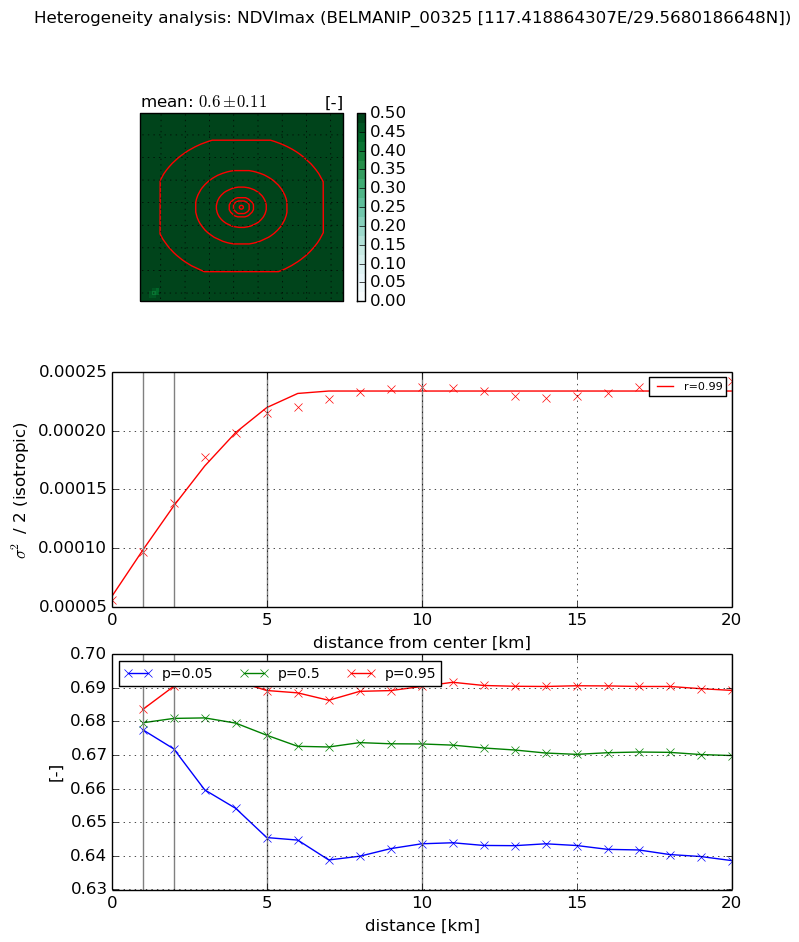
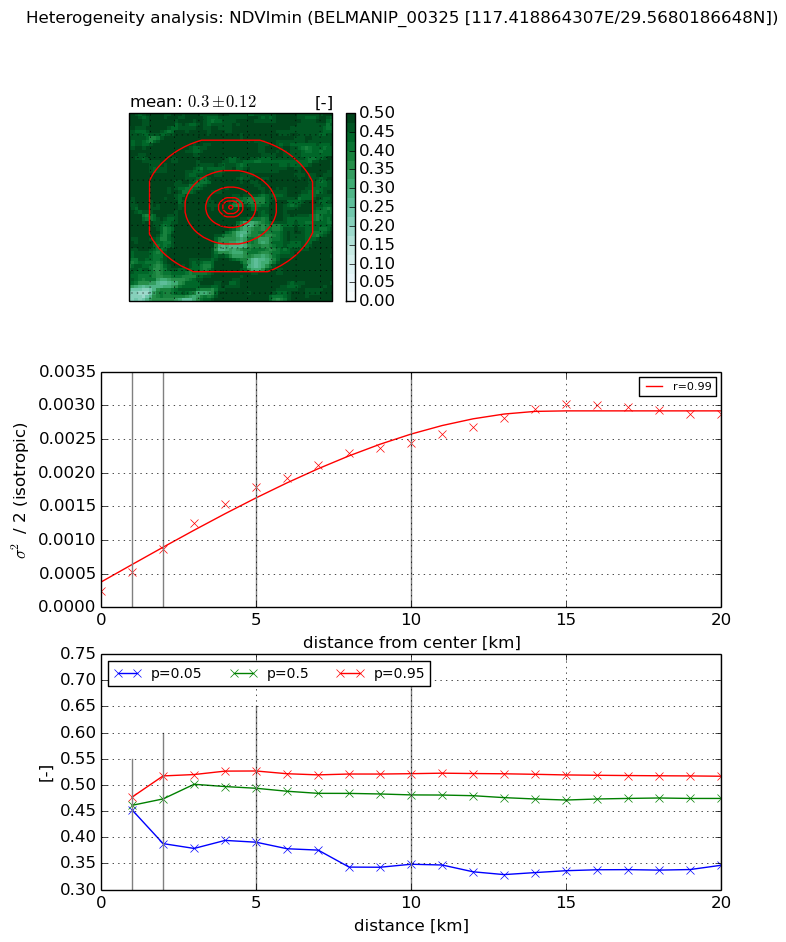
Heterogeneity analysis

The heterogeneity analysis provides information about the spatial and temporal heterogeneity of the site.

Topography


Roman et al. (2009) index


St

2.70177699135

Rcv

0.187521886757

Rse

0.0

Rst

-0.0842665547816

Rsv

0.838591878377


Height range @ 1km [m]

270

Height range @ 2km [m]

464

Height range @ 5km [m]

454

Height range @ 10km [m]

-999

Height range @ 20km [m]

-999


Variance slope @ 1 km

7399

Variance slope @ 2 km

6658

Variance slope @ 5 km

4913

Variance slope @ 10 km

-999

Variance slope @ 20 km

-999


NDVI (max. NDVI composite)


Roman et al. (2009) index


St

2.81538394094e-08

Rcv

0.368813876701

Rse

0.0

Rst

0.018629932391

Rsv

106557402.188


NDVI range @ 1km [-]

0.01

NDVI range @ 2km [-]

0.02

NDVI range @ 5km [-]

0.04

NDVI range @ 10km [-]

0.05

NDVI range @ 20km [-]

0.05


Variance slope @ 1 km

4.09473385521e-05

Variance slope @ 2 km

4.10383980348e-05

Variance slope @ 5 km

3.24858626531e-05

Variance slope @ 10 km

1.68911222343e-05

Variance slope @ 20 km

6.11508413349e-06


NDVI (min. NDVI composite)I


Roman et al. (2009) index


St

8.86364180276e-07

Rcv

-0.156649140438

Rse

0.0

Rst

0.496096792147

Rsv

3384612.65492


NDVI range @ 1km [-]

0.02

NDVI range @ 2km [-]

0.13

NDVI range @ 5km [-]

0.14

NDVI range @ 10km [-]

0.17

NDVI range @ 20km [-]

0.17


NDVI slope @ 1 km

0.000277388537789

NDVI slope @ 2 km

0.000306346650314

NDVI slope @ 5 km

0.000316776649826

NDVI slope @ 10 km

0.000225039118317

NDVI slope @ 20 km

0.000127576109238


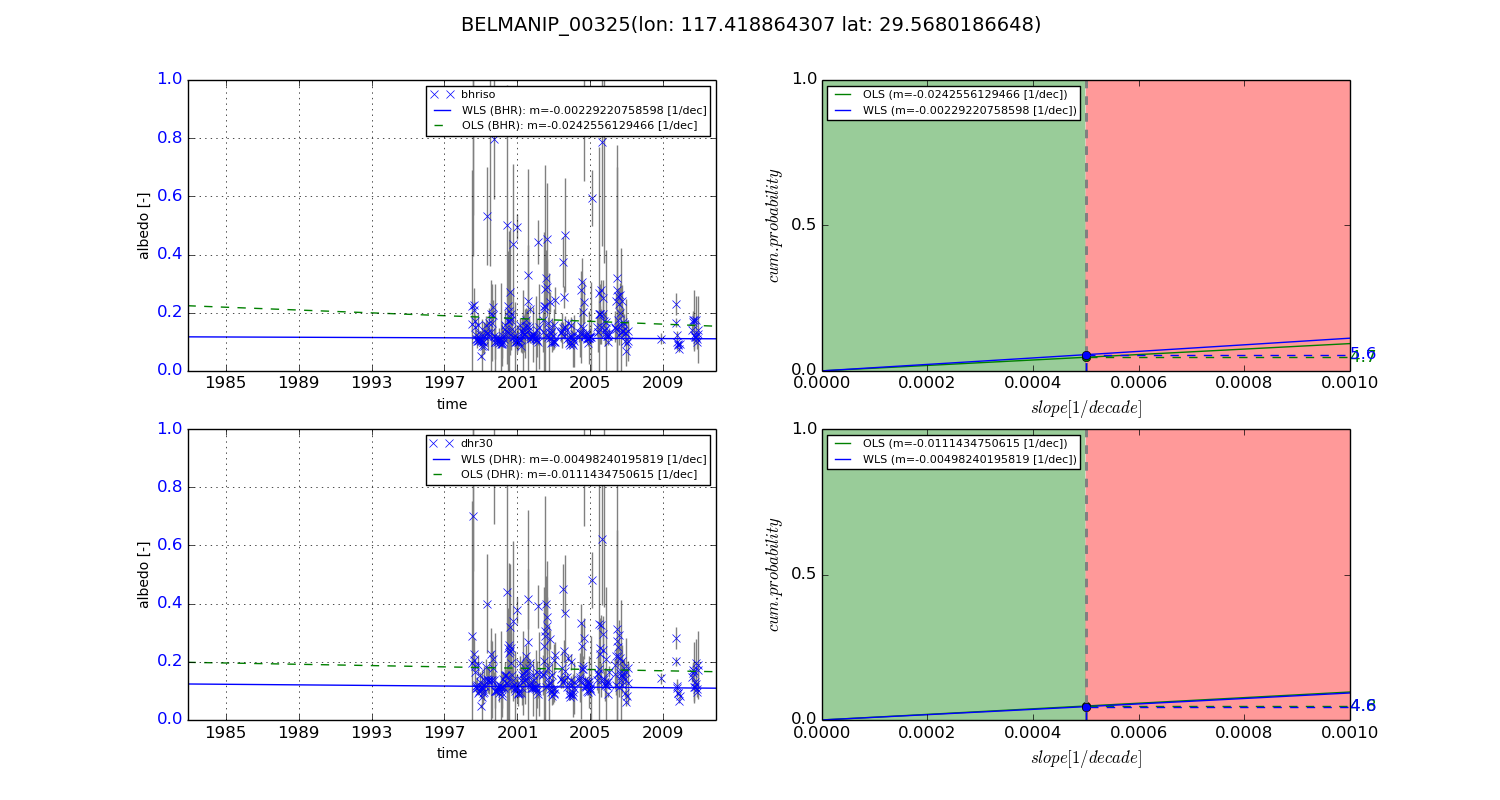
Temporal stability analysis

+000 deg (BHR)


BHR statistics

Temporal stability [1/decade]:


abs

rel


Weighted least square:

None


Ordinary least square:

None


Probabilities that GCOS criteria is met:

Weighted least square:

None %

Ordinary least square:

None %


DHR statistics

Temporal stability [1/decade]:


abs

rel


Weighted least square:

None


Ordinary least square:

None


Probabilities that GCOS criteria is met:

Weighted least square:

None %

Ordinary least square:

None %


+057/+063 deg (BHR)


BHR statistics

Temporal stability [1/decade]:


abs

rel


Weighted least square:

-0.00229220758598


Ordinary least square:

-0.0242556129466


Probabilities that GCOS criteria is met:

Weighted least square:

5.6 %

Ordinary least square:

4.7 %


DHR statistics

Temporal stability [1/decade]:


abs

rel


Weighted least square:

-0.00498240195819


Ordinary least square:

-0.0111434750615


Probabilities that GCOS criteria is met:

Weighted least square:

4.6 %

Ordinary least square:

4.8 %


Temporal anomaly analyis

The variance of the temporal anomalies provides an additional measure about the stability of the signal AFTER removal of the mean seasonal cylce.

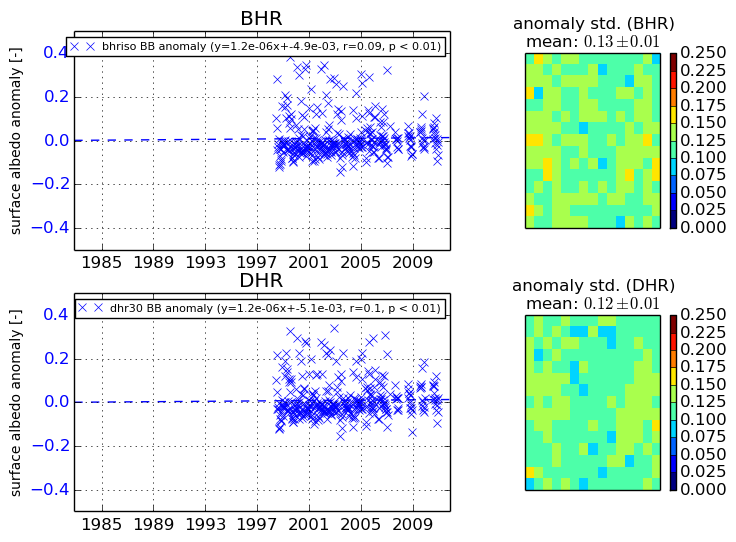
+000 deg


+057/+063 deg