BELMANIP_00326


Location

lon / lat [deg]: 105.6235 / 24.2366

Source network: BELMANIP


Geostationary surface albedo (GSA) data


“+000”


“+057/+063”


Landcover information (based on ESA CCI landcover data)


Landcover fractions @ 2km distance


Landcover fractions @ 20 km distance


Legend


Distance to open water bodies [km]:

31.99

Distance to urban areas [km]:

15.25


Radius: 1 km

Number of landcover classes:

2

Dominant landcover type:

60: Tree cover, broadleaved, decidous

Fraction of dominant landcover type [%]:

69.0


Radius: 2 km

Number of landcover classes:

5

Dominant landcover type:

60: Tree cover, broadleaved, decidous

Fraction of dominant landcover type [%]:

43.0


Radius: 5 km

Number of landcover classes:

6

Dominant landcover type:

60: Tree cover, broadleaved, decidous

Fraction of dominant landcover type [%]:

34.0


Radius: 10 km

Number of landcover classes:

8

Dominant landcover type:

50: Tree cover, broadleaved, evergreen, closed to open (>15%)

Fraction of dominant landcover type [%]:

28.0


Radius: 20 km

Number of landcover classes:

8

Dominant landcover type:

50: Tree cover, broadleaved, evergreen, closed to open (>15%)

Fraction of dominant landcover type [%]:

23.0


Disturbances


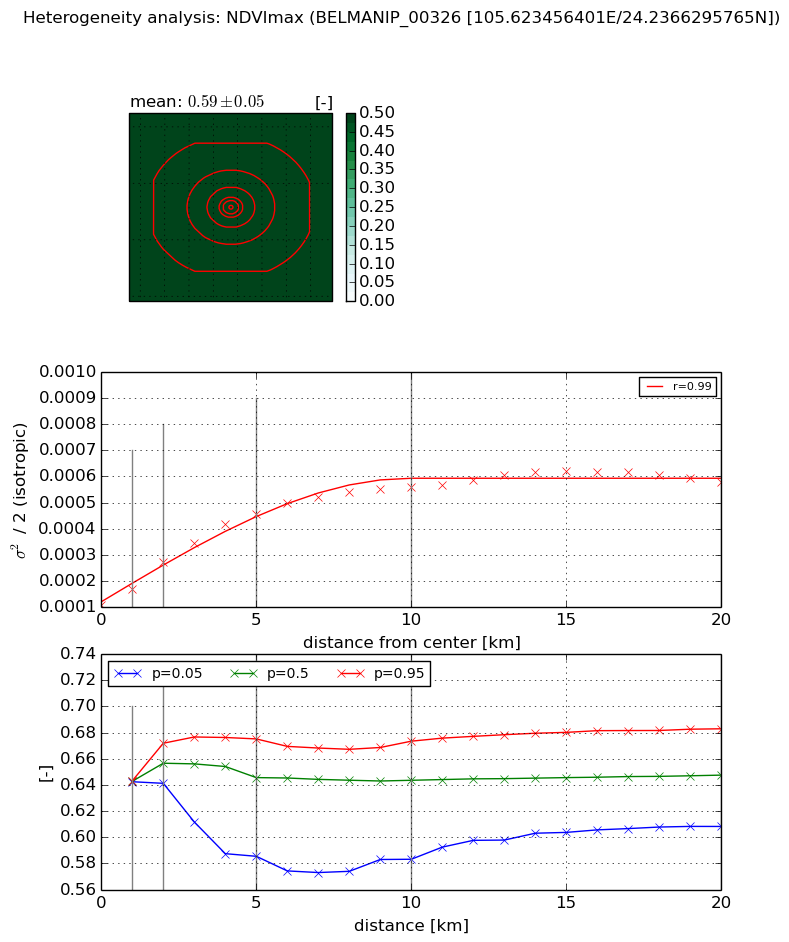
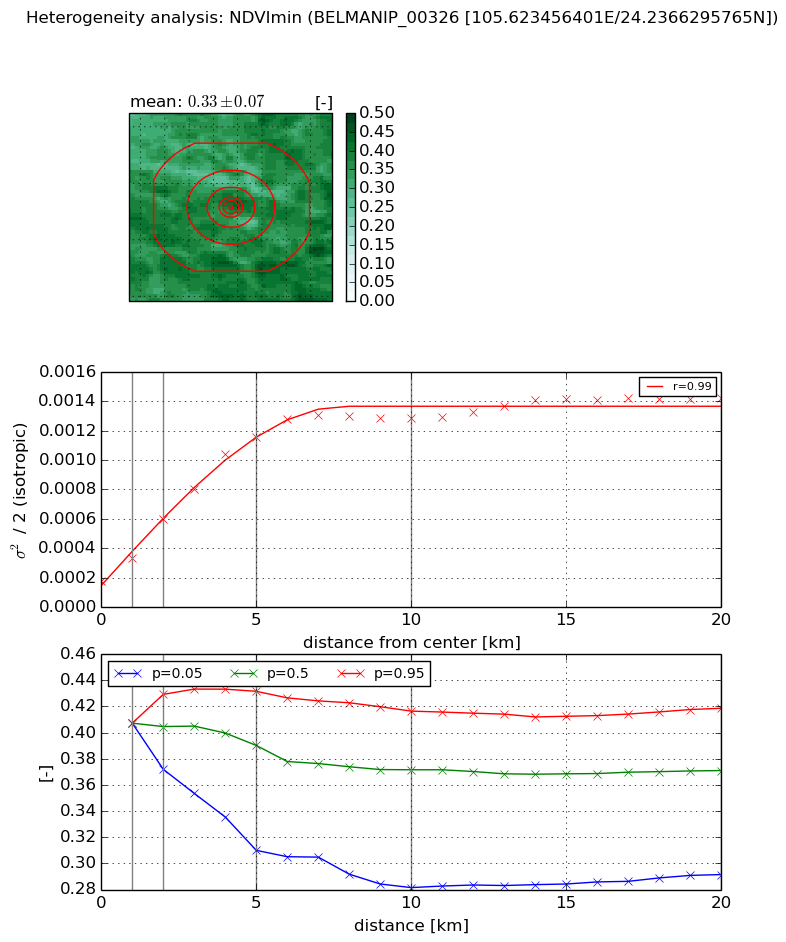
Heterogeneity analysis

The heterogeneity analysis provides information about the spatial and temporal heterogeneity of the site.

Topography


Roman et al. (2009) index


St

5.64244346811

Rcv

0.300723689712

Rse

0.0

Rst

-0.0253500248237

Rsv

0.205610832585


Height range @ 1km [m]

306

Height range @ 2km [m]

336

Height range @ 5km [m]

436

Height range @ 10km [m]

-999

Height range @ 20km [m]

-999


Variance slope @ 1 km

8124

Variance slope @ 2 km

6784

Variance slope @ 5 km

3377

Variance slope @ 10 km

-999

Variance slope @ 20 km

-999


NDVI (max. NDVI composite)


Roman et al. (2009) index


St

3.74036219097

Rcv

0.312901757636

Rse

0.0

Rst

0.189355702326

Rsv

0.299803903839


NDVI range @ 1km [-]

0.0

NDVI range @ 2km [-]

0.03

NDVI range @ 5km [-]

0.09

NDVI range @ 10km [-]

0.09

NDVI range @ 20km [-]

0.07


Variance slope @ 1 km

6.34178220713e-05

Variance slope @ 2 km

8.30558988349e-05

Variance slope @ 5 km

7.2996691236e-05

Variance slope @ 10 km

4.55228048056e-05

Variance slope @ 20 km

2.06608752806e-05


NDVI (min. NDVI composite)I


Roman et al. (2009) index


St

1.06631240681

Rcv

0.332899312905

Rse

0.0

Rst

0.195988009536

Rsv

2.28454707149


NDVI range @ 1km [-]

0.0

NDVI range @ 2km [-]

0.06

NDVI range @ 5km [-]

0.12

NDVI range @ 10km [-]

0.14

NDVI range @ 20km [-]

0.13


NDVI slope @ 1 km

0.00015546949597

NDVI slope @ 2 km

0.000210451626859

NDVI slope @ 5 km

0.000206099441567

NDVI slope @ 10 km

0.000115338190718

NDVI slope @ 20 km

4.84804821165e-05


Temporal stability analysis

+000 deg (BHR)


BHR statistics

Temporal stability [1/decade]:


abs

rel


Weighted least square:

None


Ordinary least square:

None


Probabilities that GCOS criteria is met:

Weighted least square:

None %

Ordinary least square:

None %


DHR statistics

Temporal stability [1/decade]:


abs

rel


Weighted least square:

None


Ordinary least square:

None


Probabilities that GCOS criteria is met:

Weighted least square:

None %

Ordinary least square:

None %


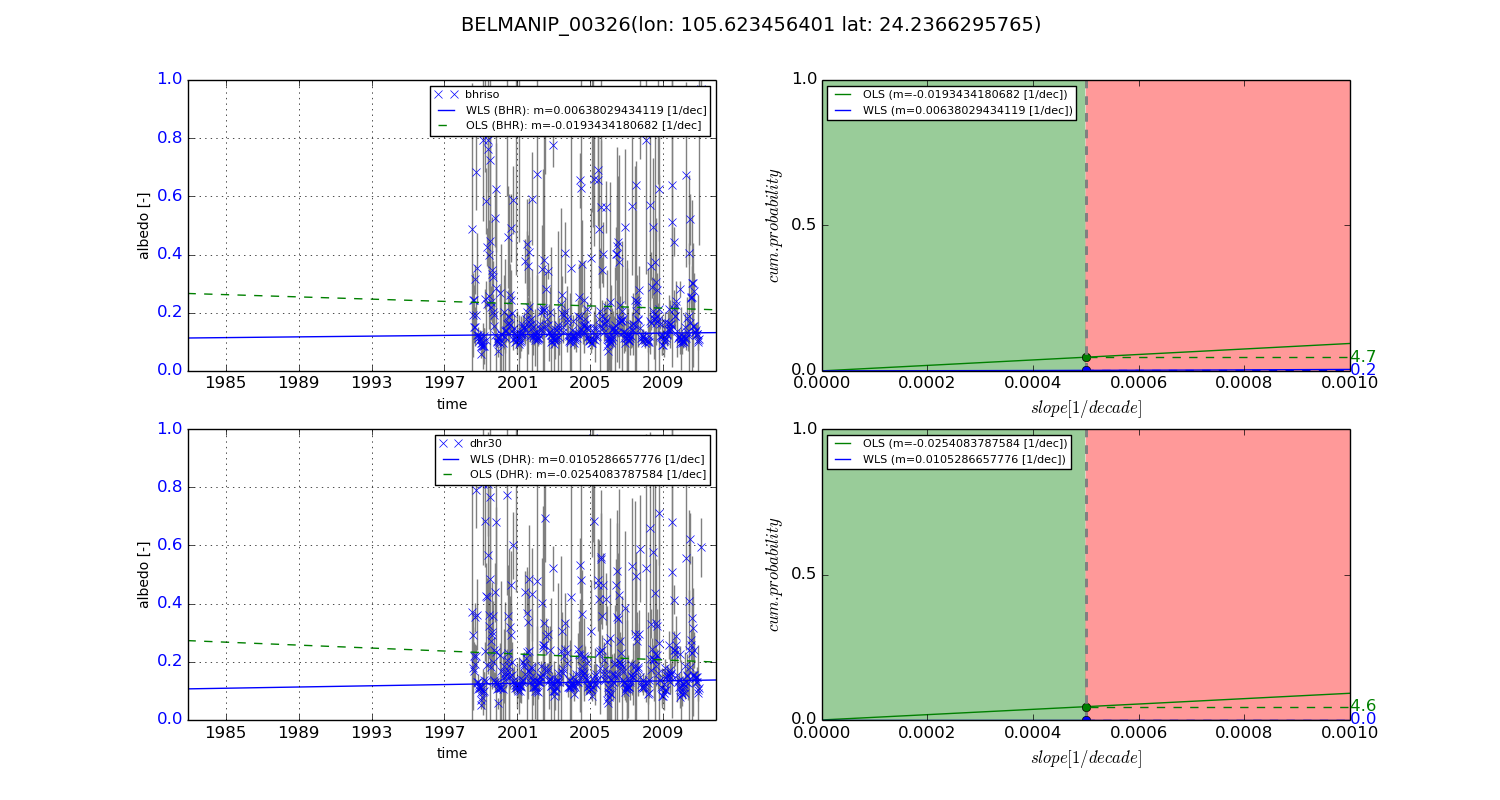
+057/+063 deg (BHR)


BHR statistics

Temporal stability [1/decade]:


abs

rel


Weighted least square:

0.00638029434119


Ordinary least square:

-0.0193434180682


Probabilities that GCOS criteria is met:

Weighted least square:

0.2 %

Ordinary least square:

4.7 %


DHR statistics

Temporal stability [1/decade]:


abs

rel


Weighted least square:

0.0105286657776


Ordinary least square:

-0.0254083787584


Probabilities that GCOS criteria is met:

Weighted least square:

0.0 %

Ordinary least square:

4.6 %


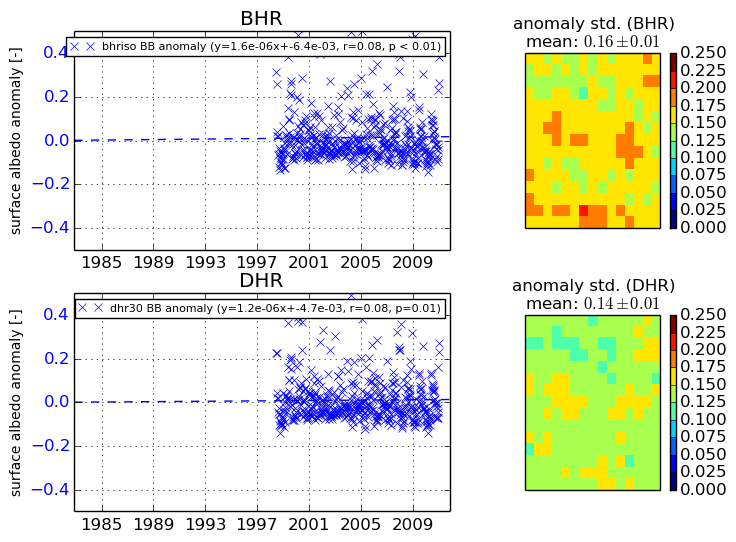
Temporal anomaly analyis

The variance of the temporal anomalies provides an additional measure about the stability of the signal AFTER removal of the mean seasonal cylce.

+000 deg


+057/+063 deg