BELMANIP_00336


Location

lon / lat [deg]: 95.2395 / 21.1686

Source network: BELMANIP


Geostationary surface albedo (GSA) data


“+000”


“+057/+063”


Landcover information (based on ESA CCI landcover data)


Landcover fractions @ 2km distance


Landcover fractions @ 20 km distance


Legend


Distance to open water bodies [km]:

8.55

Distance to urban areas [km]:

7.31


Radius: 1 km

Number of landcover classes:

2

Dominant landcover type:

10: cropland, rainfed

Fraction of dominant landcover type [%]:

94.0


Radius: 2 km

Number of landcover classes:

3

Dominant landcover type:

10: cropland, rainfed

Fraction of dominant landcover type [%]:

81.0


Radius: 5 km

Number of landcover classes:

3

Dominant landcover type:

10: cropland, rainfed

Fraction of dominant landcover type [%]:

85.0


Radius: 10 km

Number of landcover classes:

3

Dominant landcover type:

10: cropland, rainfed

Fraction of dominant landcover type [%]:

82.0


Radius: 20 km

Number of landcover classes:

4

Dominant landcover type:

10: cropland, rainfed

Fraction of dominant landcover type [%]:

75.0


Disturbances


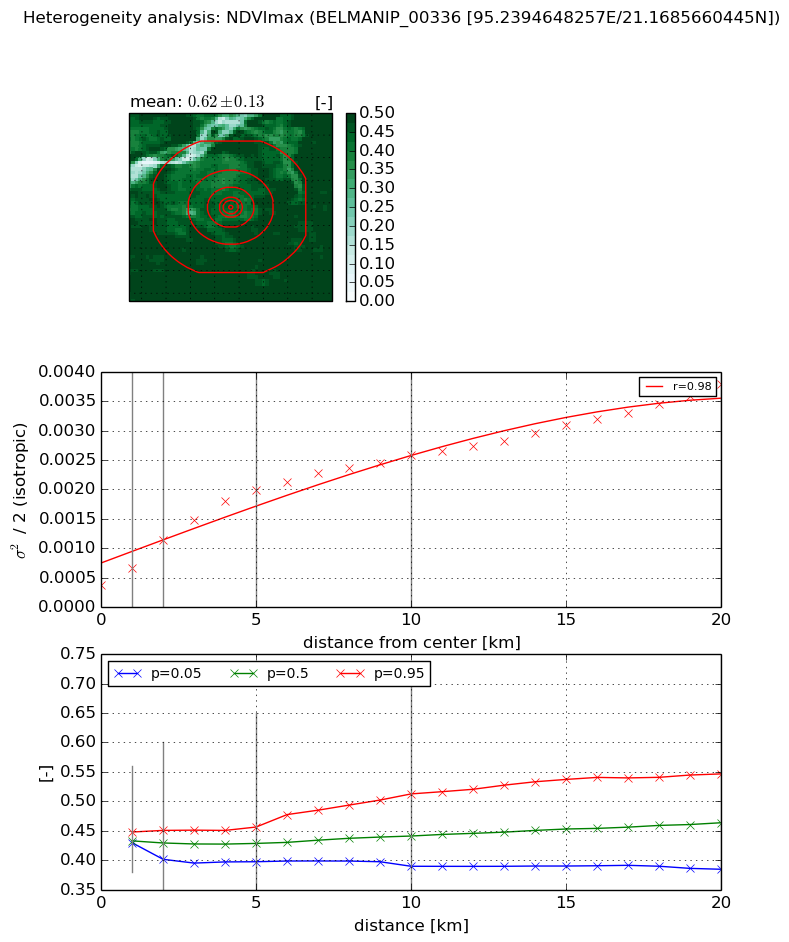
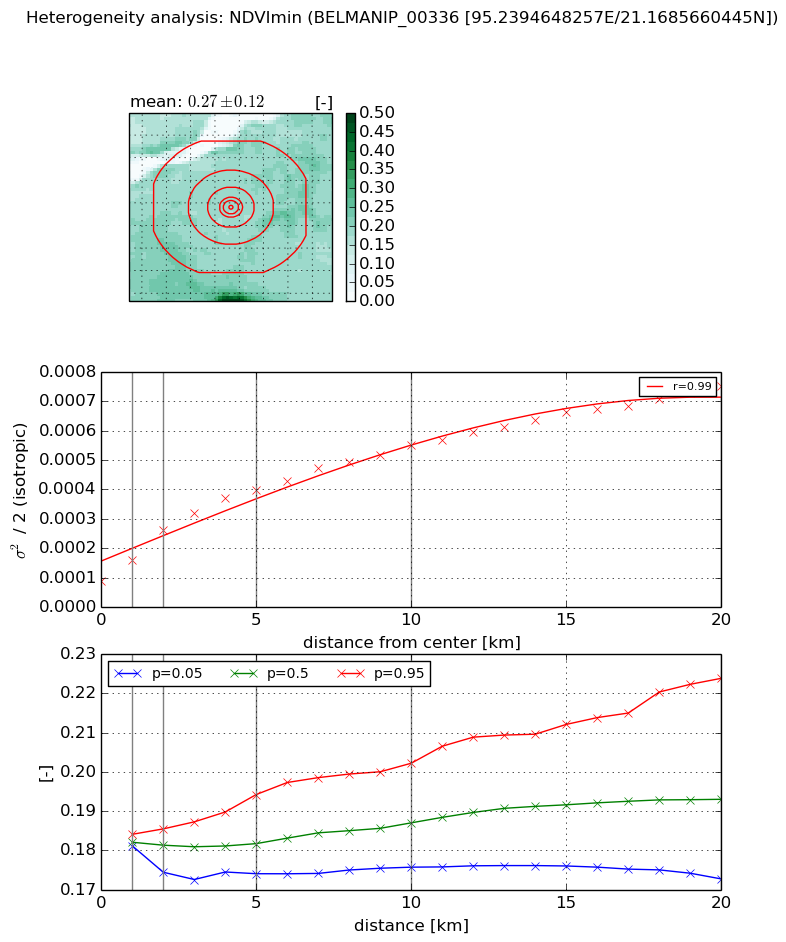
Heterogeneity analysis

The heterogeneity analysis provides information about the spatial and temporal heterogeneity of the site.

Topography


Roman et al. (2009) index


St

0.25364734845

Rcv

0.449882453367

Rse

0.0

Rst

2.922685984e-05

Rsv

11.3775330707


Height range @ 1km [m]

22

Height range @ 2km [m]

41

Height range @ 5km [m]

86

Height range @ 10km [m]

-999

Height range @ 20km [m]

-999


Variance slope @ 1 km

86

Variance slope @ 2 km

100

Variance slope @ 5 km

148

Variance slope @ 10 km

-999

Variance slope @ 20 km

-999


NDVI (max. NDVI composite)


Roman et al. (2009) index


St

5.59669828325

Rcv

-0.0814036440345

Rse

0.0

Rst

0.232378283886

Rsv

-0.222248397134


NDVI range @ 1km [-]

0.02

NDVI range @ 2km [-]

0.05

NDVI range @ 5km [-]

0.06

NDVI range @ 10km [-]

0.12

NDVI range @ 20km [-]

0.16


Variance slope @ 1 km

0.000291758383462

Variance slope @ 2 km

0.00039000029642

Variance slope @ 5 km

0.000338177931057

Variance slope @ 10 km

0.000216871358103

Variance slope @ 20 km

0.000144920439607


NDVI (min. NDVI composite)I


Roman et al. (2009) index


St

0.294518054256

Rcv

0.32047142052

Rse

0.0

Rst

6.49181195942e-09

Rsv

9.86566133003


NDVI range @ 1km [-]

0.0

NDVI range @ 2km [-]

0.01

NDVI range @ 5km [-]

0.02

NDVI range @ 10km [-]

0.03

NDVI range @ 20km [-]

0.05


NDVI slope @ 1 km

6.95471330879e-05

NDVI slope @ 2 km

8.59462286276e-05

NDVI slope @ 5 km

6.39581645437e-05

NDVI slope @ 10 km

4.35709251173e-05

NDVI slope @ 20 km

2.91751396697e-05


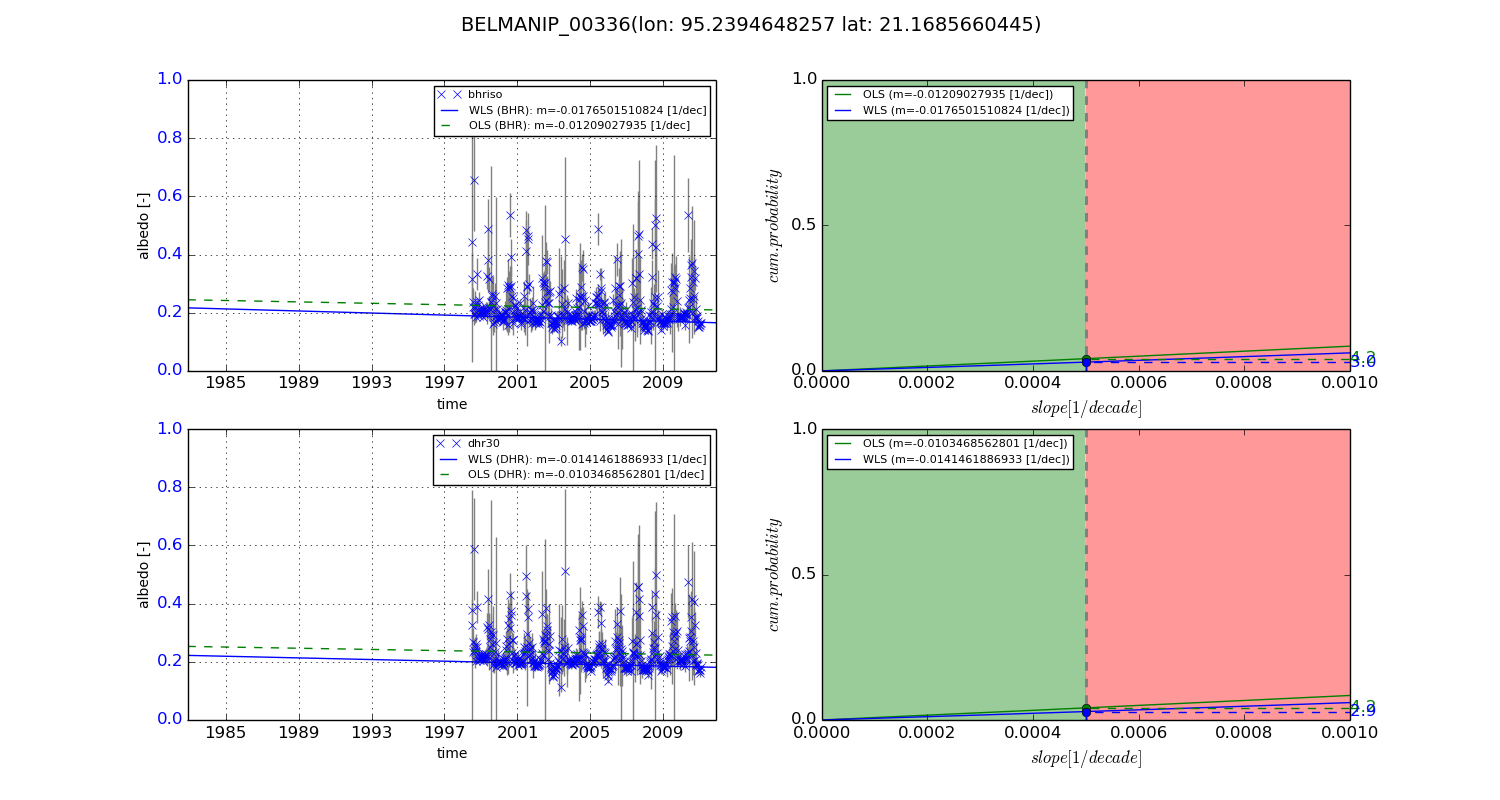
Temporal stability analysis

+000 deg (BHR)


BHR statistics

Temporal stability [1/decade]:


abs

rel


Weighted least square:

None


Ordinary least square:

None


Probabilities that GCOS criteria is met:

Weighted least square:

None %

Ordinary least square:

None %


DHR statistics

Temporal stability [1/decade]:


abs

rel


Weighted least square:

None


Ordinary least square:

None


Probabilities that GCOS criteria is met:

Weighted least square:

None %

Ordinary least square:

None %


+057/+063 deg (BHR)


BHR statistics

Temporal stability [1/decade]:


abs

rel


Weighted least square:

-0.0176501510824


Ordinary least square:

-0.01209027935


Probabilities that GCOS criteria is met:

Weighted least square:

3.0 %

Ordinary least square:

4.2 %


DHR statistics

Temporal stability [1/decade]:


abs

rel


Weighted least square:

-0.0141461886933


Ordinary least square:

-0.0103468562801


Probabilities that GCOS criteria is met:

Weighted least square:

2.9 %

Ordinary least square:

4.2 %


Temporal anomaly analyis

The variance of the temporal anomalies provides an additional measure about the stability of the signal AFTER removal of the mean seasonal cylce.

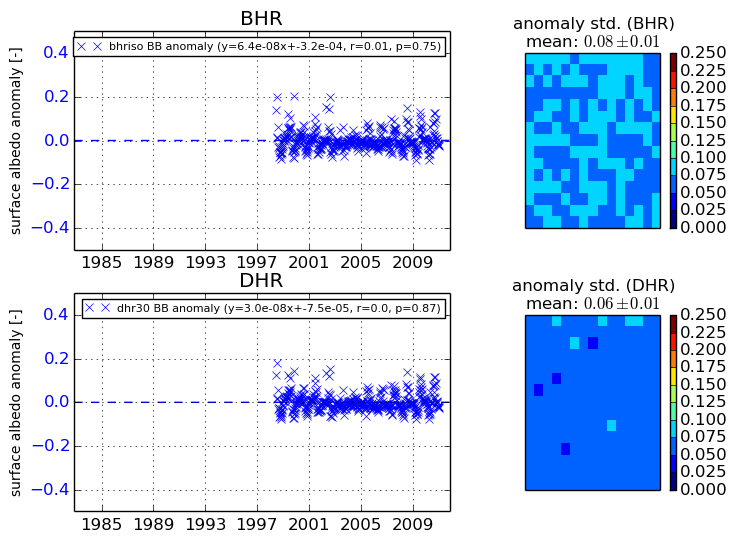
+000 deg


+057/+063 deg