BELMANIP_00337


Location

lon / lat [deg]: 106.0219 / 21.1464

Source network: BELMANIP


Geostationary surface albedo (GSA) data


“+000”


“+057/+063”


Landcover information (based on ESA CCI landcover data)


Landcover fractions @ 2km distance


Landcover fractions @ 20 km distance


Legend


Distance to open water bodies [km]:

7.79

Distance to urban areas [km]:

4.16


Radius: 1 km

Number of landcover classes:

3

Dominant landcover type:

10: cropland, rainfed

Fraction of dominant landcover type [%]:

76.0


Radius: 2 km

Number of landcover classes:

3

Dominant landcover type:

10: cropland, rainfed

Fraction of dominant landcover type [%]:

68.0


Radius: 5 km

Number of landcover classes:

4

Dominant landcover type:

10: cropland, rainfed

Fraction of dominant landcover type [%]:

67.0


Radius: 10 km

Number of landcover classes:

5

Dominant landcover type:

10: cropland, rainfed

Fraction of dominant landcover type [%]:

67.0


Radius: 20 km

Number of landcover classes:

5

Dominant landcover type:

10: cropland, rainfed

Fraction of dominant landcover type [%]:

57.0


Disturbances


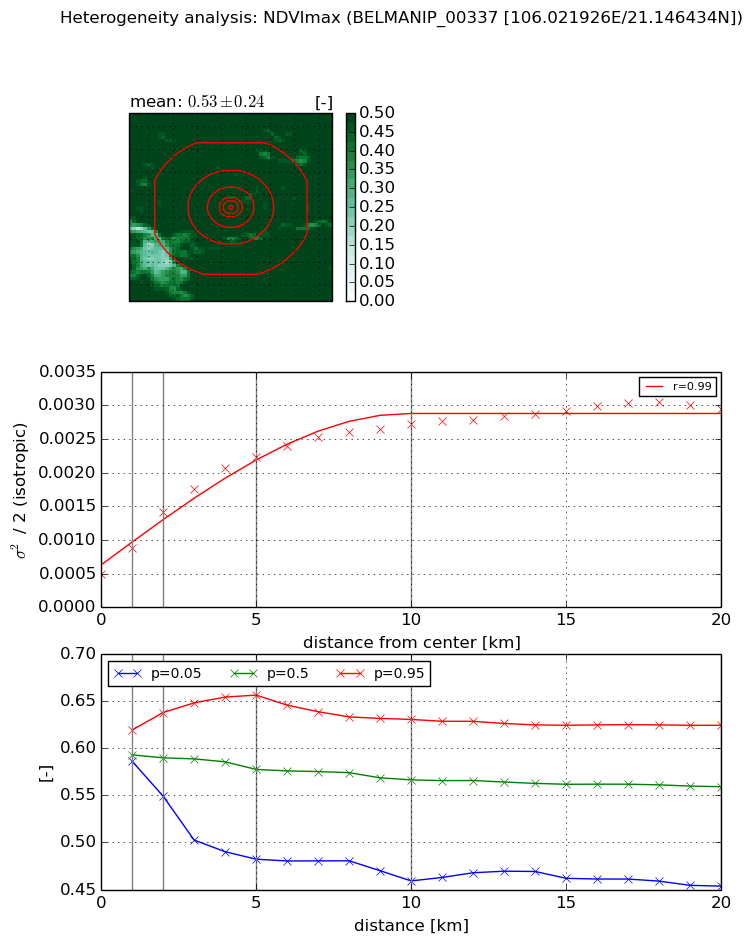
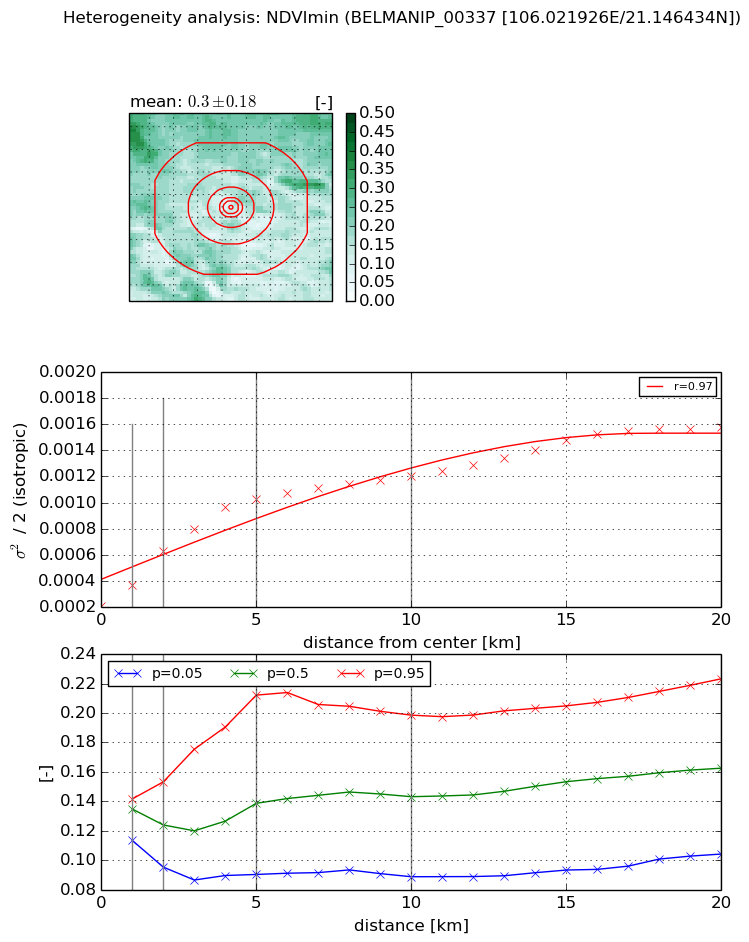
Heterogeneity analysis

The heterogeneity analysis provides information about the spatial and temporal heterogeneity of the site.

Topography


Roman et al. (2009) index


St

nan

Rcv

nan

Rse

nan

Rst

nan

Rsv

nan


Height range @ 1km [m]

7

Height range @ 2km [m]

6

Height range @ 5km [m]

13

Height range @ 10km [m]

-999

Height range @ 20km [m]

-999


Variance slope @ 1 km

38

Variance slope @ 2 km

15

Variance slope @ 5 km

2

Variance slope @ 10 km

-999

Variance slope @ 20 km

-999


NDVI (max. NDVI composite)


Roman et al. (2009) index


St

6.47960560212

Rcv

0.177233175546

Rse

0.0

Rst

-0.0971408641422

Rsv

0.188617102708


NDVI range @ 1km [-]

0.03

NDVI range @ 2km [-]

0.09

NDVI range @ 5km [-]

0.17

NDVI range @ 10km [-]

0.17

NDVI range @ 20km [-]

0.17


Variance slope @ 1 km

0.000377671881152

Variance slope @ 2 km

0.000463728795591

Variance slope @ 5 km

0.000360638391427

Variance slope @ 10 km

0.000215266654182

Variance slope @ 20 km

0.000101356878209


NDVI (min. NDVI composite)I


Roman et al. (2009) index


St

3.70200099543

Rcv

0.1094880881

Rse

0.0

Rst

-0.247433219588

Rsv

0.453451245887


NDVI range @ 1km [-]

0.03

NDVI range @ 2km [-]

0.06

NDVI range @ 5km [-]

0.12

NDVI range @ 10km [-]

0.11

NDVI range @ 20km [-]

0.12


NDVI slope @ 1 km

0.000161220363511

NDVI slope @ 2 km

0.000209928261502

NDVI slope @ 5 km

0.000173017255902

NDVI slope @ 10 km

9.50614554271e-05

NDVI slope @ 20 km

5.85210132541e-05


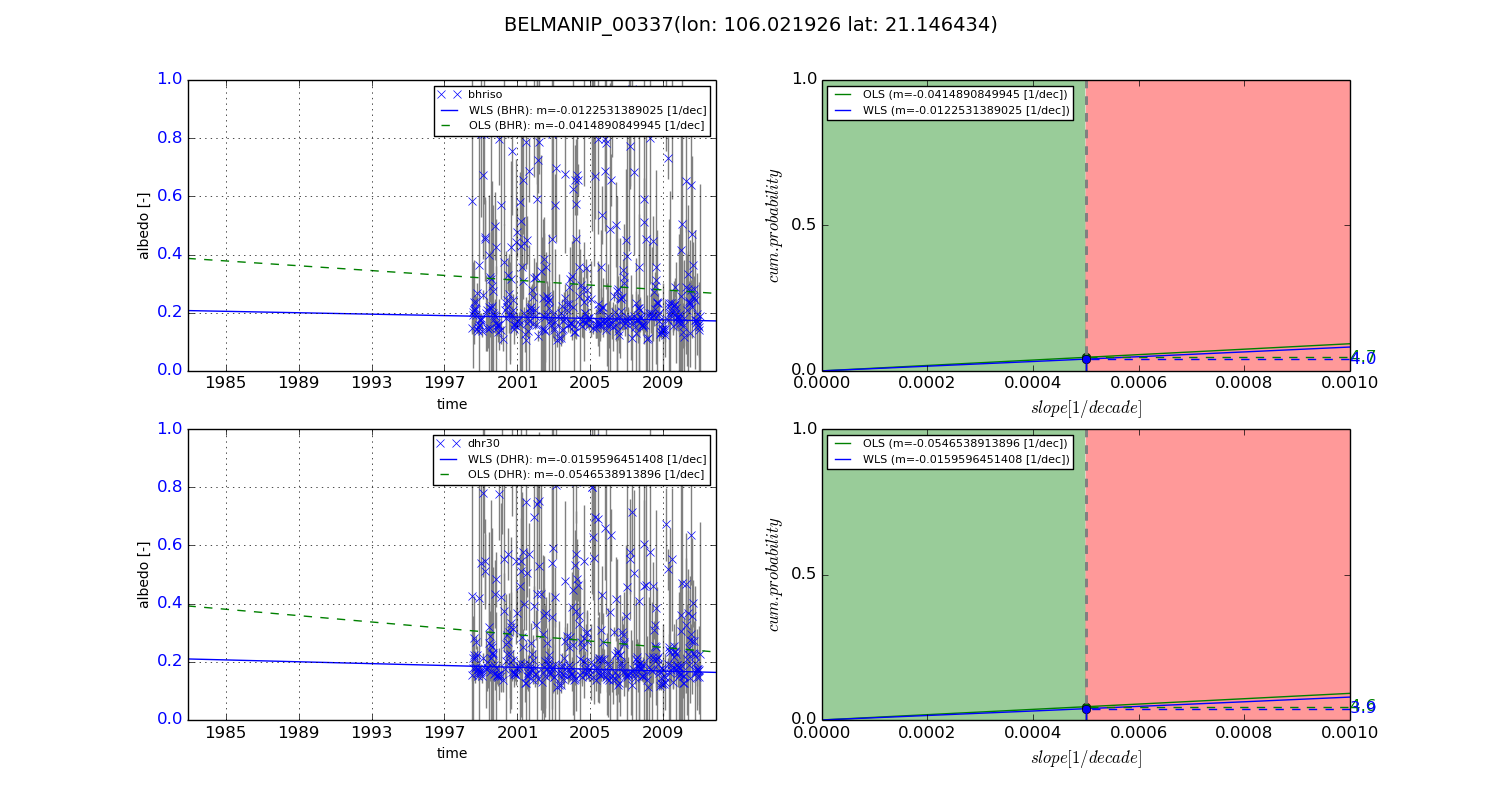
Temporal stability analysis

+000 deg (BHR)


BHR statistics

Temporal stability [1/decade]:


abs

rel


Weighted least square:

None


Ordinary least square:

None


Probabilities that GCOS criteria is met:

Weighted least square:

None %

Ordinary least square:

None %


DHR statistics

Temporal stability [1/decade]:


abs

rel


Weighted least square:

None


Ordinary least square:

None


Probabilities that GCOS criteria is met:

Weighted least square:

None %

Ordinary least square:

None %


+057/+063 deg (BHR)


BHR statistics

Temporal stability [1/decade]:


abs

rel


Weighted least square:

-0.0122531389025


Ordinary least square:

-0.0414890849945


Probabilities that GCOS criteria is met:

Weighted least square:

4.0 %

Ordinary least square:

4.7 %


DHR statistics

Temporal stability [1/decade]:


abs

rel


Weighted least square:

-0.0159596451408


Ordinary least square:

-0.0546538913896


Probabilities that GCOS criteria is met:

Weighted least square:

3.9 %

Ordinary least square:

4.6 %


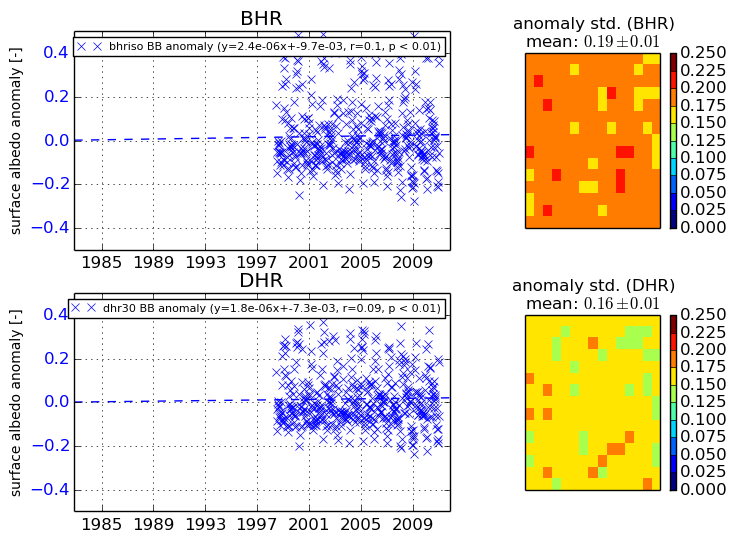
Temporal anomaly analyis

The variance of the temporal anomalies provides an additional measure about the stability of the signal AFTER removal of the mean seasonal cylce.

+000 deg


+057/+063 deg