BELMANIP_00339


Location

lon / lat [deg]: 60.7606 / 28.9142

Source network: BELMANIP


Geostationary surface albedo (GSA) data


“+000”


“+057/+063”


Landcover information (based on ESA CCI landcover data)


Landcover fractions @ 2km distance


Landcover fractions @ 20 km distance


Legend


Distance to open water bodies [km]:

37.03

Distance to urban areas [km]:

29.39


Radius: 1 km

Number of landcover classes:

1

Dominant landcover type:

200: bare areas

Fraction of dominant landcover type [%]:

100.0


Radius: 2 km

Number of landcover classes:

1

Dominant landcover type:

200: bare areas

Fraction of dominant landcover type [%]:

100.0


Radius: 5 km

Number of landcover classes:

1

Dominant landcover type:

200: bare areas

Fraction of dominant landcover type [%]:

100.0


Radius: 10 km

Number of landcover classes:

2

Dominant landcover type:

200: bare areas

Fraction of dominant landcover type [%]:

97.0


Radius: 20 km

Number of landcover classes:

2

Dominant landcover type:

200: bare areas

Fraction of dominant landcover type [%]:

96.0


Disturbances


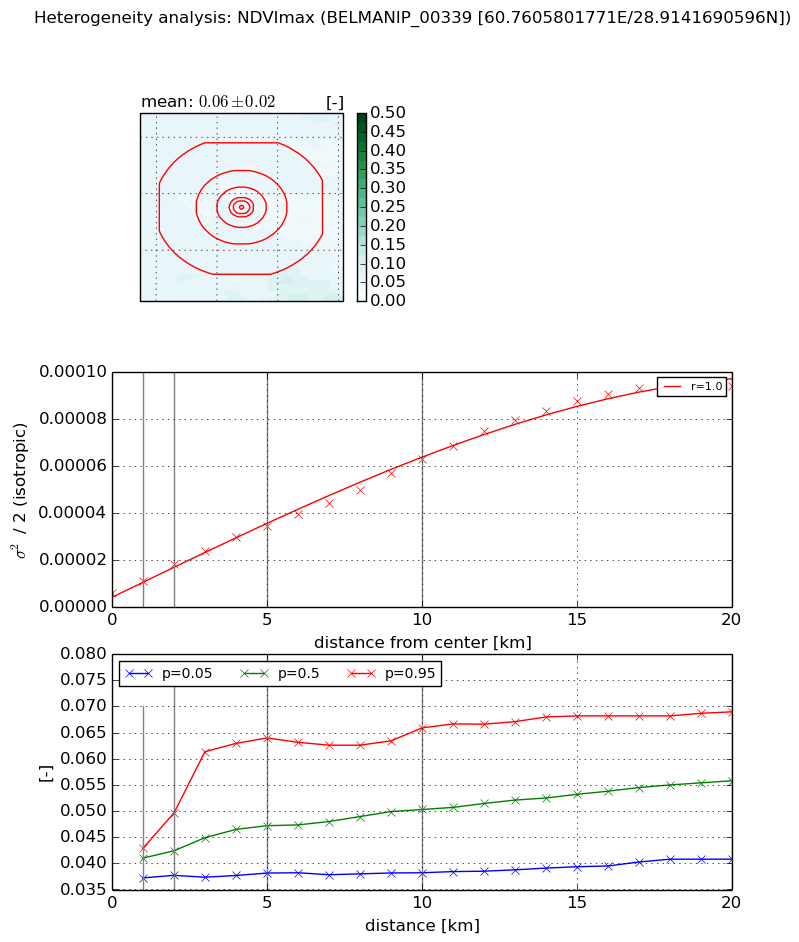
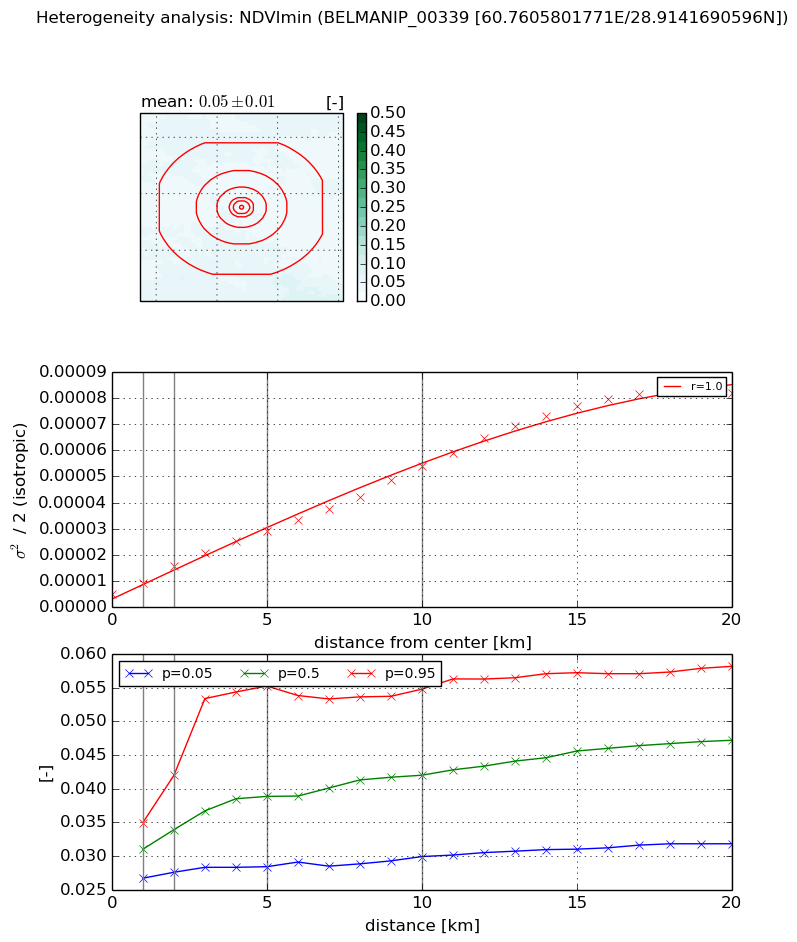
Heterogeneity analysis

The heterogeneity analysis provides information about the spatial and temporal heterogeneity of the site.

Topography


Roman et al. (2009) index


St

5.39954808892

Rcv

0.178251774828

Rse

0.0

Rst

7.00595466784e-08

Rsv

0.377350207469


Height range @ 1km [m]

136

Height range @ 2km [m]

177

Height range @ 5km [m]

253

Height range @ 10km [m]

-999

Height range @ 20km [m]

-999


Variance slope @ 1 km

827

Variance slope @ 2 km

964

Variance slope @ 5 km

1278

Variance slope @ 10 km

-999

Variance slope @ 20 km

-999


NDVI (max. NDVI composite)


Roman et al. (2009) index


St

1.67502112118

Rcv

0.103920882331

Rse

0.0

Rst

-0.369062815458

Rsv

1.31803849415


NDVI range @ 1km [-]

0.01

NDVI range @ 2km [-]

0.01

NDVI range @ 5km [-]

0.03

NDVI range @ 10km [-]

0.03

NDVI range @ 20km [-]

0.03


Variance slope @ 1 km

4.83859558712e-06

Variance slope @ 2 km

6.09742086876e-06

Variance slope @ 5 km

5.79475836378e-06

Variance slope @ 10 km

5.57500052331e-06

Variance slope @ 20 km

4.79527254763e-06


NDVI (min. NDVI composite)I


Roman et al. (2009) index


St

1.46351243195

Rcv

0.0175684214067

Rse

0.0

Rst

-0.460382208707

Rsv

1.57191238062


NDVI range @ 1km [-]

0.01

NDVI range @ 2km [-]

0.01

NDVI range @ 5km [-]

0.03

NDVI range @ 10km [-]

0.02

NDVI range @ 20km [-]

0.03


NDVI slope @ 1 km

4.12071836288e-06

NDVI slope @ 2 km

5.27981019093e-06

NDVI slope @ 5 km

4.94052411284e-06

NDVI slope @ 10 km

4.75877756937e-06

NDVI slope @ 20 km

4.2256858371e-06


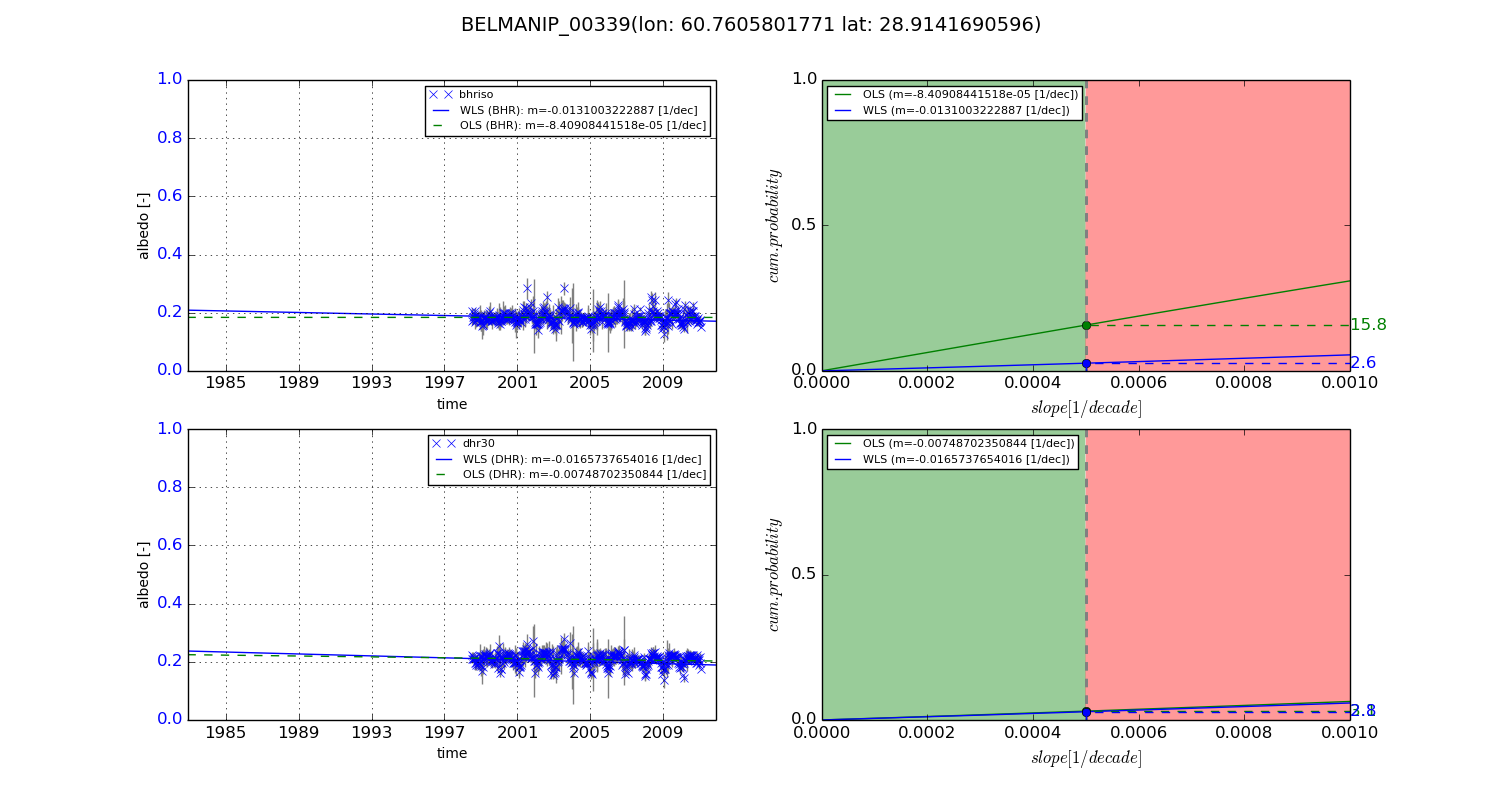
Temporal stability analysis

+000 deg (BHR)


BHR statistics

Temporal stability [1/decade]:


abs

rel


Weighted least square:

-99999.0


Ordinary least square:

-99999.0


Probabilities that GCOS criteria is met:

Weighted least square:

-99999.0 %

Ordinary least square:

-99999.0 %


DHR statistics

Temporal stability [1/decade]:


abs

rel


Weighted least square:

-99999.0


Ordinary least square:

-99999.0


Probabilities that GCOS criteria is met:

Weighted least square:

-99999.0 %

Ordinary least square:

-99999.0 %


+057/+063 deg (BHR)


BHR statistics

Temporal stability [1/decade]:


abs

rel


Weighted least square:

-0.0131003222887


Ordinary least square:

-8.40908441518e-05


Probabilities that GCOS criteria is met:

Weighted least square:

2.6 %

Ordinary least square:

15.8 %


DHR statistics

Temporal stability [1/decade]:


abs

rel


Weighted least square:

-0.0165737654016


Ordinary least square:

-0.00748702350844


Probabilities that GCOS criteria is met:

Weighted least square:

2.8 %

Ordinary least square:

3.1 %


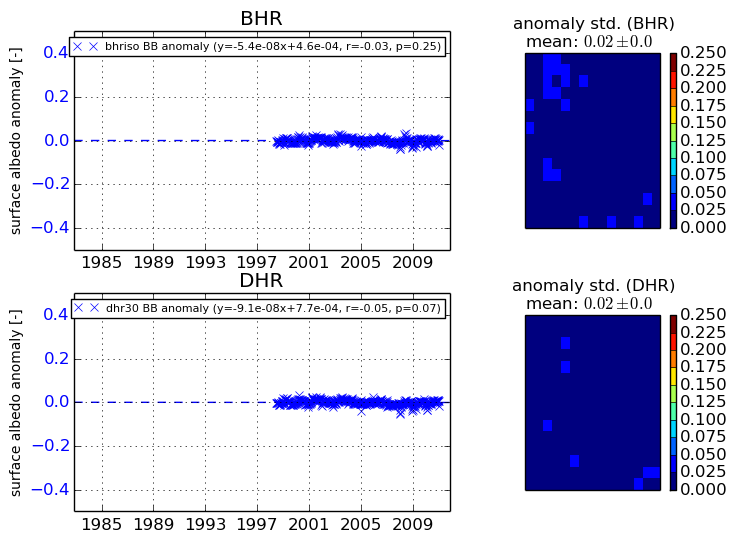
Temporal anomaly analyis

The variance of the temporal anomalies provides an additional measure about the stability of the signal AFTER removal of the mean seasonal cylce.
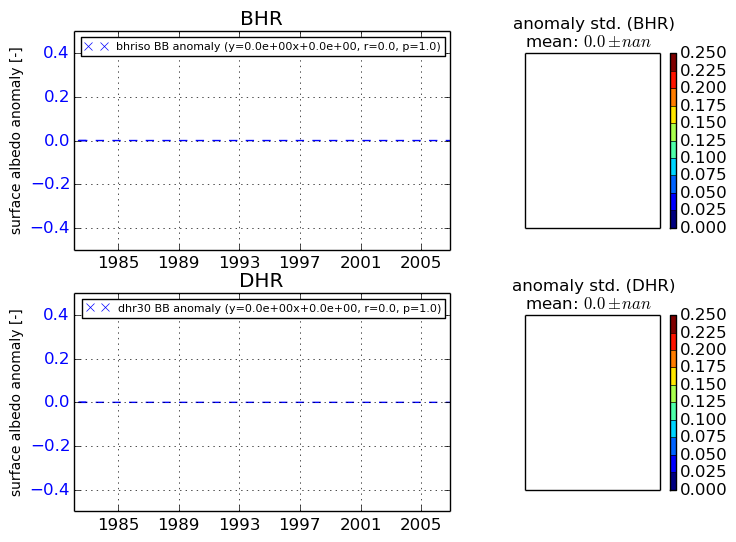
+000 deg


+057/+063 deg