BELMANIP_00346


Location

lon / lat [deg]: 86.3677 / 33.3648

Source network: BELMANIP


Geostationary surface albedo (GSA) data


“+000”


“+057/+063”


Landcover information (based on ESA CCI landcover data)


Landcover fractions @ 2km distance


Landcover fractions @ 20 km distance


Legend


Distance to open water bodies [km]:

15.8

Distance to urban areas [km]:

none in region


Radius: 1 km

Number of landcover classes:

3

Dominant landcover type:

130: grassland

Fraction of dominant landcover type [%]:

51.0


Radius: 2 km

Number of landcover classes:

4

Dominant landcover type:

130: grassland

Fraction of dominant landcover type [%]:

66.0


Radius: 5 km

Number of landcover classes:

3

Dominant landcover type:

130: grassland

Fraction of dominant landcover type [%]:

86.0


Radius: 10 km

Number of landcover classes:

3

Dominant landcover type:

130: grassland

Fraction of dominant landcover type [%]:

95.0


Radius: 20 km

Number of landcover classes:

4

Dominant landcover type:

130: grassland

Fraction of dominant landcover type [%]:

90.0


Disturbances


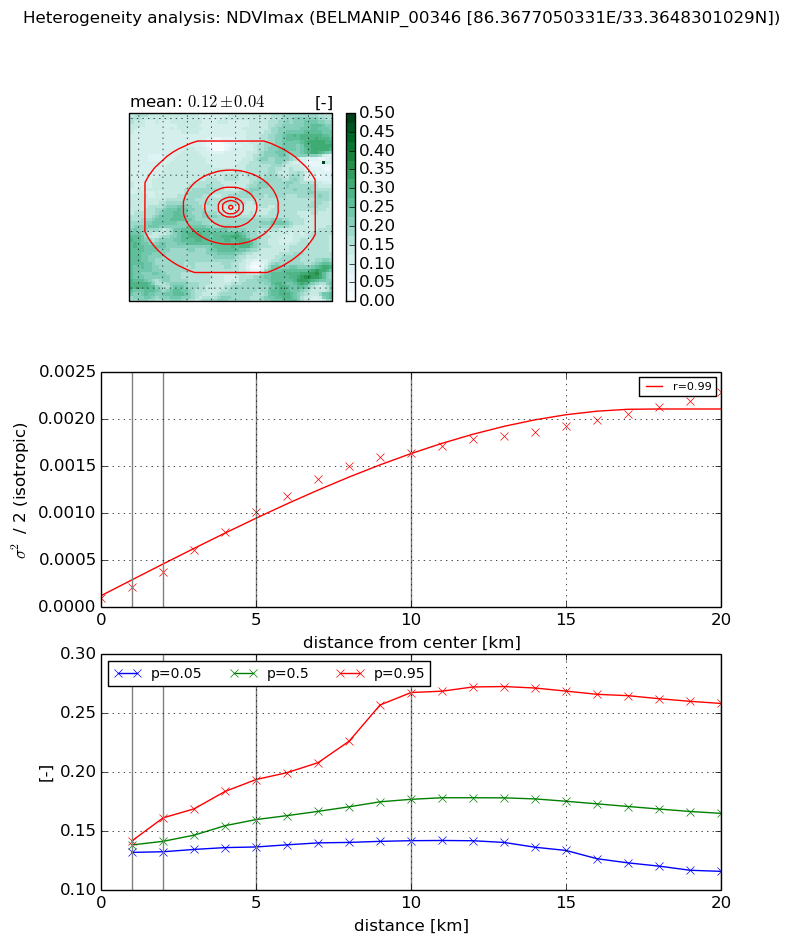
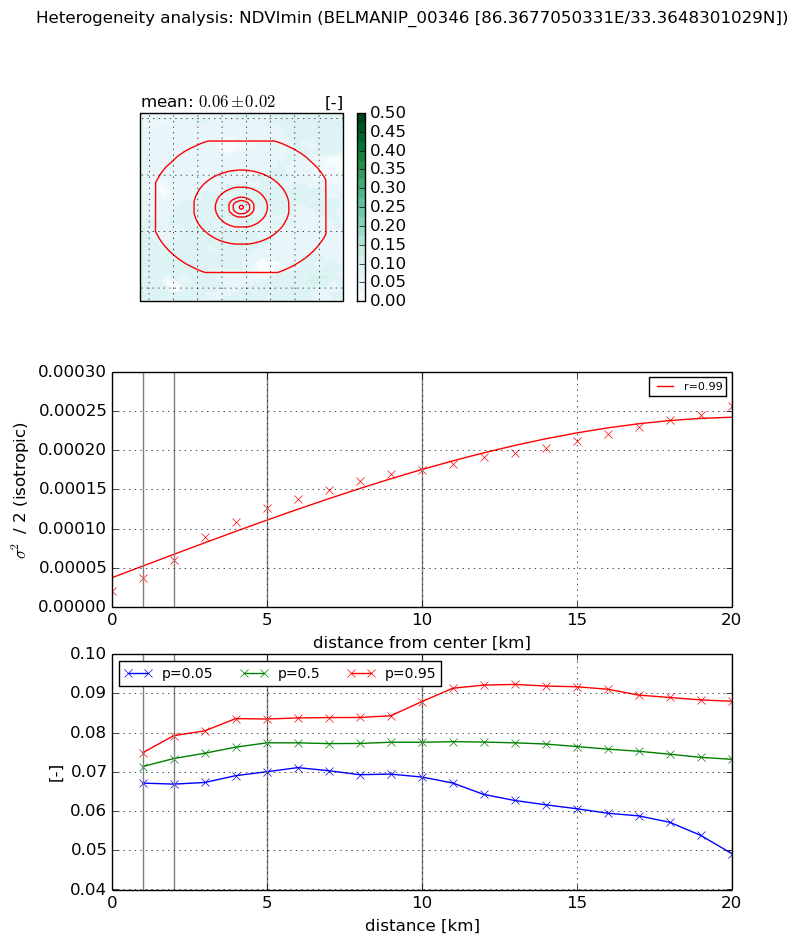
Heterogeneity analysis

The heterogeneity analysis provides information about the spatial and temporal heterogeneity of the site.

Topography


Roman et al. (2009) index


St

2.42767040378

Rcv

0.752521824359

Rse

0.0

Rst

-0.0169505873808

Rsv

0.466280182732


Height range @ 1km [m]

33

Height range @ 2km [m]

55

Height range @ 5km [m]

180

Height range @ 10km [m]

-999

Height range @ 20km [m]

-999


Variance slope @ 1 km

706

Variance slope @ 2 km

734

Variance slope @ 5 km

812

Variance slope @ 10 km

-999

Variance slope @ 20 km

-999


NDVI (max. NDVI composite)


Roman et al. (2009) index


St

2.96758922075

Rcv

0.400603941268

Rse

0.0

Rst

-0.0985981399084

Rsv

0.511719504273


NDVI range @ 1km [-]

0.01

NDVI range @ 2km [-]

0.03

NDVI range @ 5km [-]

0.06

NDVI range @ 10km [-]

0.13

NDVI range @ 20km [-]

0.14


Variance slope @ 1 km

0.000117339238586

Variance slope @ 2 km

0.000140067247444

Variance slope @ 5 km

0.000187763693411

Variance slope @ 10 km

0.000168200899025

Variance slope @ 20 km

0.000104231787149


NDVI (min. NDVI composite)I


Roman et al. (2009) index


St

9.46516121609

Rcv

-0.0528826591984

Rse

0.0

Rst

-0.110744442044

Rsv

0.153324710936


NDVI range @ 1km [-]

0.01

NDVI range @ 2km [-]

0.01

NDVI range @ 5km [-]

0.01

NDVI range @ 10km [-]

0.02

NDVI range @ 20km [-]

0.04


NDVI slope @ 1 km

1.70260493239e-05

NDVI slope @ 2 km

1.96158670793e-05

NDVI slope @ 5 km

2.20644713218e-05

NDVI slope @ 10 km

1.59200818029e-05

NDVI slope @ 20 km

1.06424969271e-05


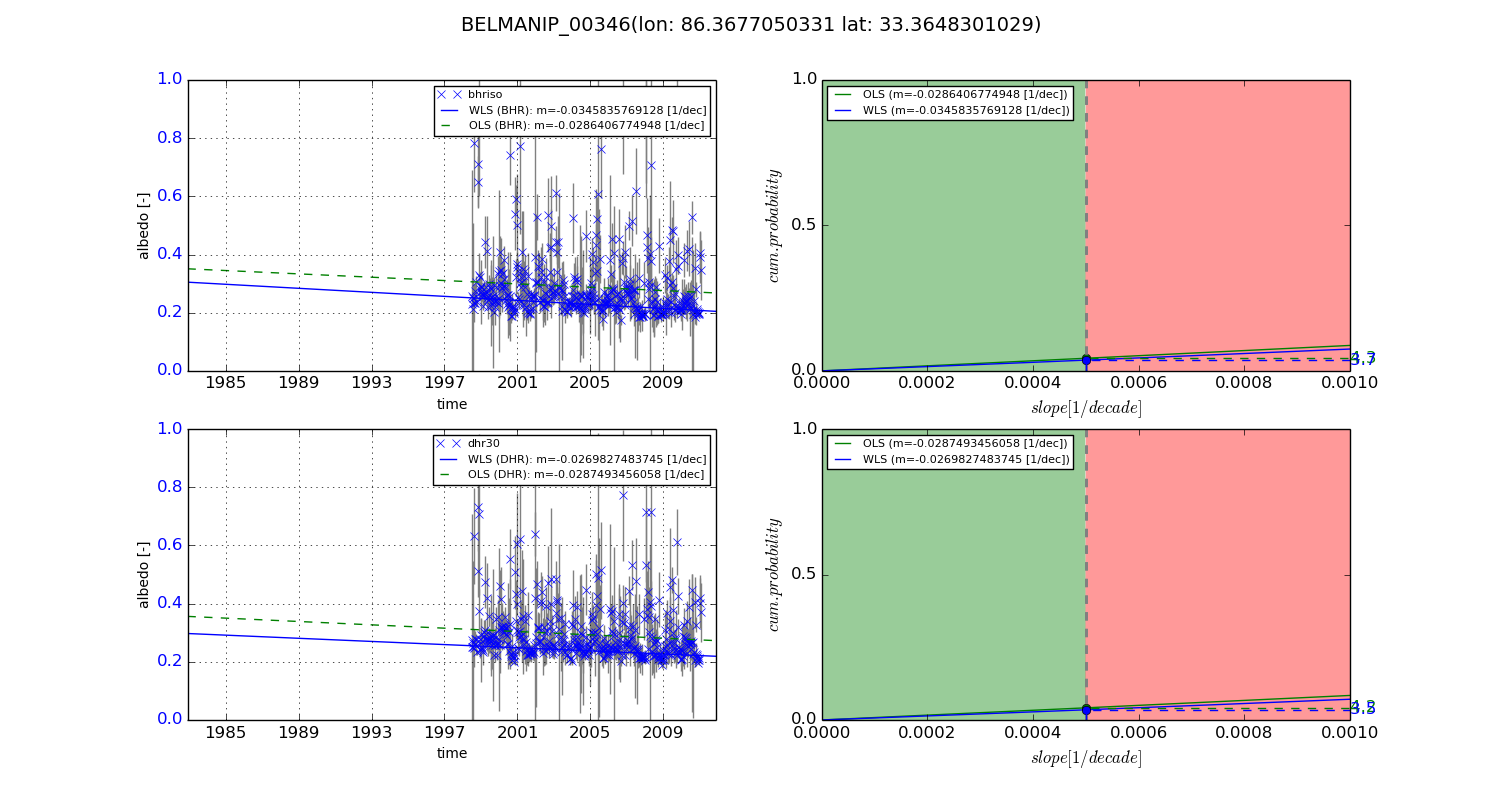
Temporal stability analysis

+000 deg (BHR)


BHR statistics

Temporal stability [1/decade]:


abs

rel


Weighted least square:

None


Ordinary least square:

None


Probabilities that GCOS criteria is met:

Weighted least square:

None %

Ordinary least square:

None %


DHR statistics

Temporal stability [1/decade]:


abs

rel


Weighted least square:

None


Ordinary least square:

None


Probabilities that GCOS criteria is met:

Weighted least square:

None %

Ordinary least square:

None %


+057/+063 deg (BHR)


BHR statistics

Temporal stability [1/decade]:


abs

rel


Weighted least square:

-0.0345835769128


Ordinary least square:

-0.0286406774948


Probabilities that GCOS criteria is met:

Weighted least square:

3.7 %

Ordinary least square:

4.3 %


DHR statistics

Temporal stability [1/decade]:


abs

rel


Weighted least square:

-0.0269827483745


Ordinary least square:

-0.0287493456058


Probabilities that GCOS criteria is met:

Weighted least square:

3.5 %

Ordinary least square:

4.2 %


Temporal anomaly analyis

The variance of the temporal anomalies provides an additional measure about the stability of the signal AFTER removal of the mean seasonal cylce.

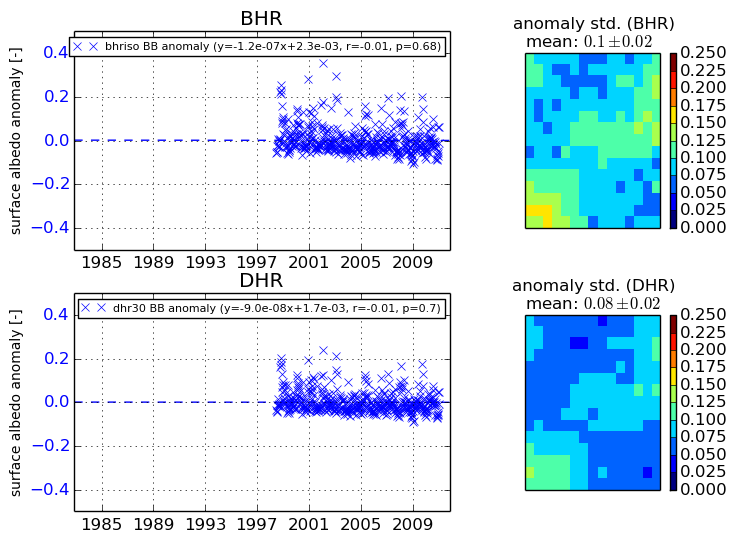
+000 deg


+057/+063 deg