BELMANIP_00355


Location

lon / lat [deg]: 105.6235 / 31.1183

Source network: BELMANIP


Geostationary surface albedo (GSA) data


“+000”


“+057/+063”


Landcover information (based on ESA CCI landcover data)


Landcover fractions @ 2km distance


Landcover fractions @ 20 km distance


Legend


Distance to open water bodies [km]:

13.36

Distance to urban areas [km]:

22.47


Radius: 1 km

Number of landcover classes:

2

Dominant landcover type:

10: cropland, rainfed

Fraction of dominant landcover type [%]:

68.0


Radius: 2 km

Number of landcover classes:

5

Dominant landcover type:

10: cropland, rainfed

Fraction of dominant landcover type [%]:

52.0


Radius: 5 km

Number of landcover classes:

4

Dominant landcover type:

10: cropland, rainfed

Fraction of dominant landcover type [%]:

65.0


Radius: 10 km

Number of landcover classes:

4

Dominant landcover type:

10: cropland, rainfed

Fraction of dominant landcover type [%]:

66.0


Radius: 20 km

Number of landcover classes:

4

Dominant landcover type:

10: cropland, rainfed

Fraction of dominant landcover type [%]:

62.0


Disturbances


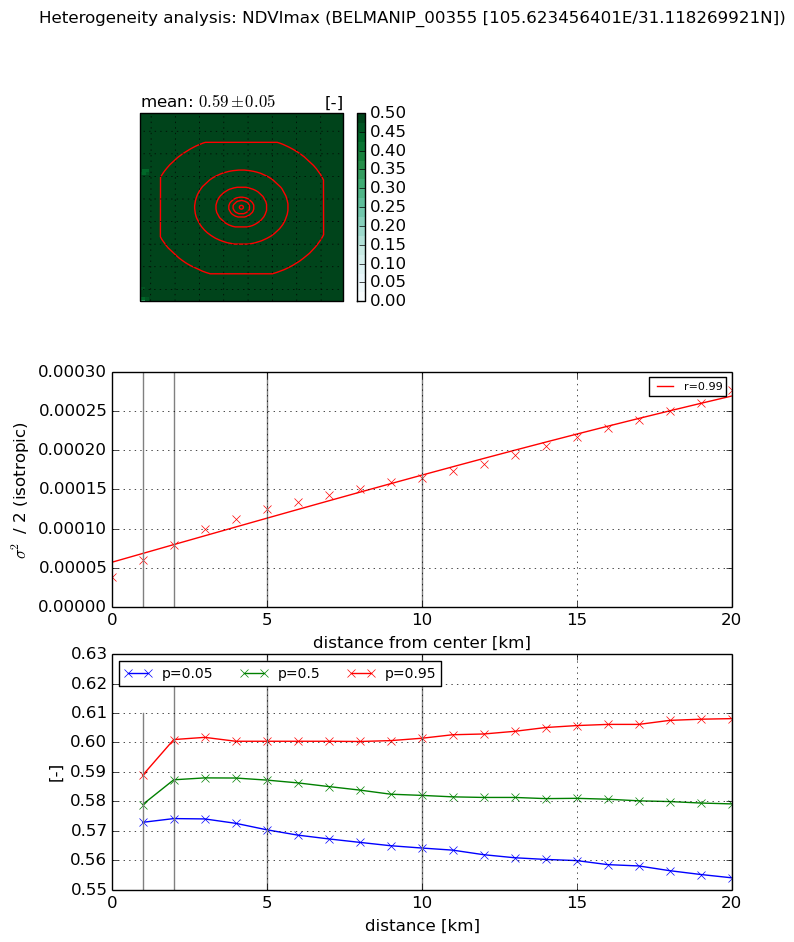
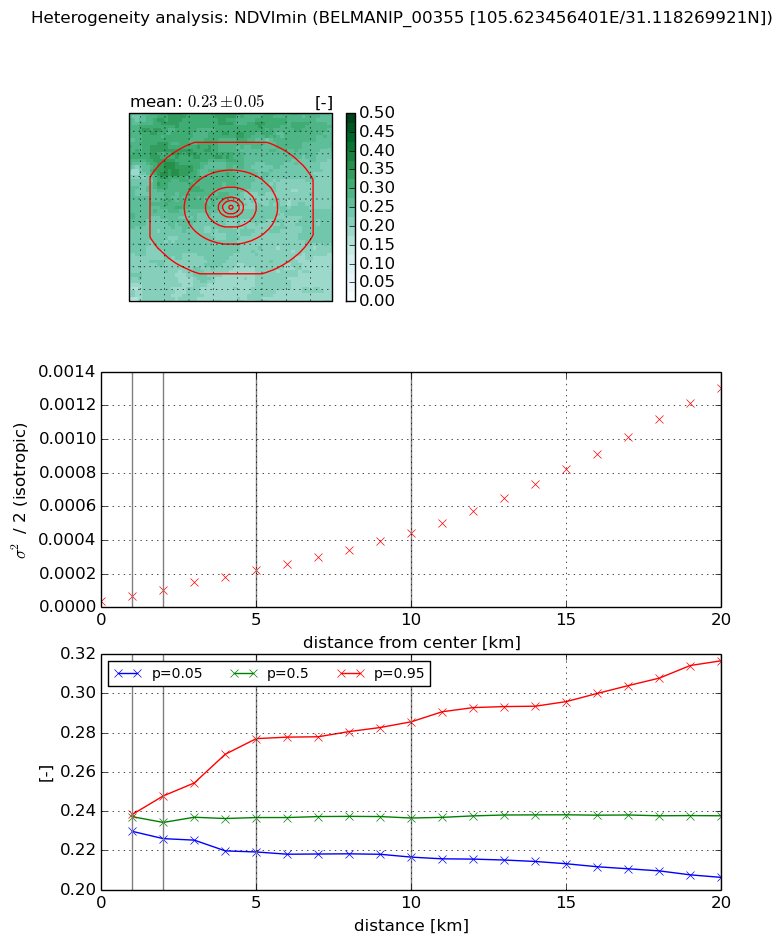
Heterogeneity analysis

The heterogeneity analysis provides information about the spatial and temporal heterogeneity of the site.

Topography


Roman et al. (2009) index


St

0.00055282301312

Rcv

0.273425976506

Rse

0.0

Rst

0.157906531398

Rsv

5426.26026462


Height range @ 1km [m]

62

Height range @ 2km [m]

59

Height range @ 5km [m]

81

Height range @ 10km [m]

-999

Height range @ 20km [m]

-999


Variance slope @ 1 km

531

Variance slope @ 2 km

187

Variance slope @ 5 km

53

Variance slope @ 10 km

-999

Variance slope @ 20 km

-999


NDVI (max. NDVI composite)


Roman et al. (2009) index


St

2.32392891936

Rcv

0.111388103686

Rse

0.0

Rst

-0.425673643282

Rsv

0.753855533251


NDVI range @ 1km [-]

0.02

NDVI range @ 2km [-]

0.03

NDVI range @ 5km [-]

0.03

NDVI range @ 10km [-]

0.04

NDVI range @ 20km [-]

0.05


Variance slope @ 1 km

2.15443904319e-05

Variance slope @ 2 km

2.05509297798e-05

Variance slope @ 5 km

1.73562271104e-05

Variance slope @ 10 km

1.22641524591e-05

Variance slope @ 20 km

1.06572826881e-05


NDVI (min. NDVI composite)I


Roman et al. (2009) index


St

1.64708626993

Rcv

0.828766815149

Rse

0.0

Rst

-1.72822686495e-08

Rsv

-0.992631387425


NDVI range @ 1km [-]

0.01

NDVI range @ 2km [-]

0.02

NDVI range @ 5km [-]

0.06

NDVI range @ 10km [-]

0.07

NDVI range @ 20km [-]

0.11


NDVI slope @ 1 km

2.99386290281e-05

NDVI slope @ 2 km

3.28789081941e-05

NDVI slope @ 5 km

3.78542735167e-05

NDVI slope @ 10 km

4.02403971233e-05

NDVI slope @ 20 km

6.24696039123e-05


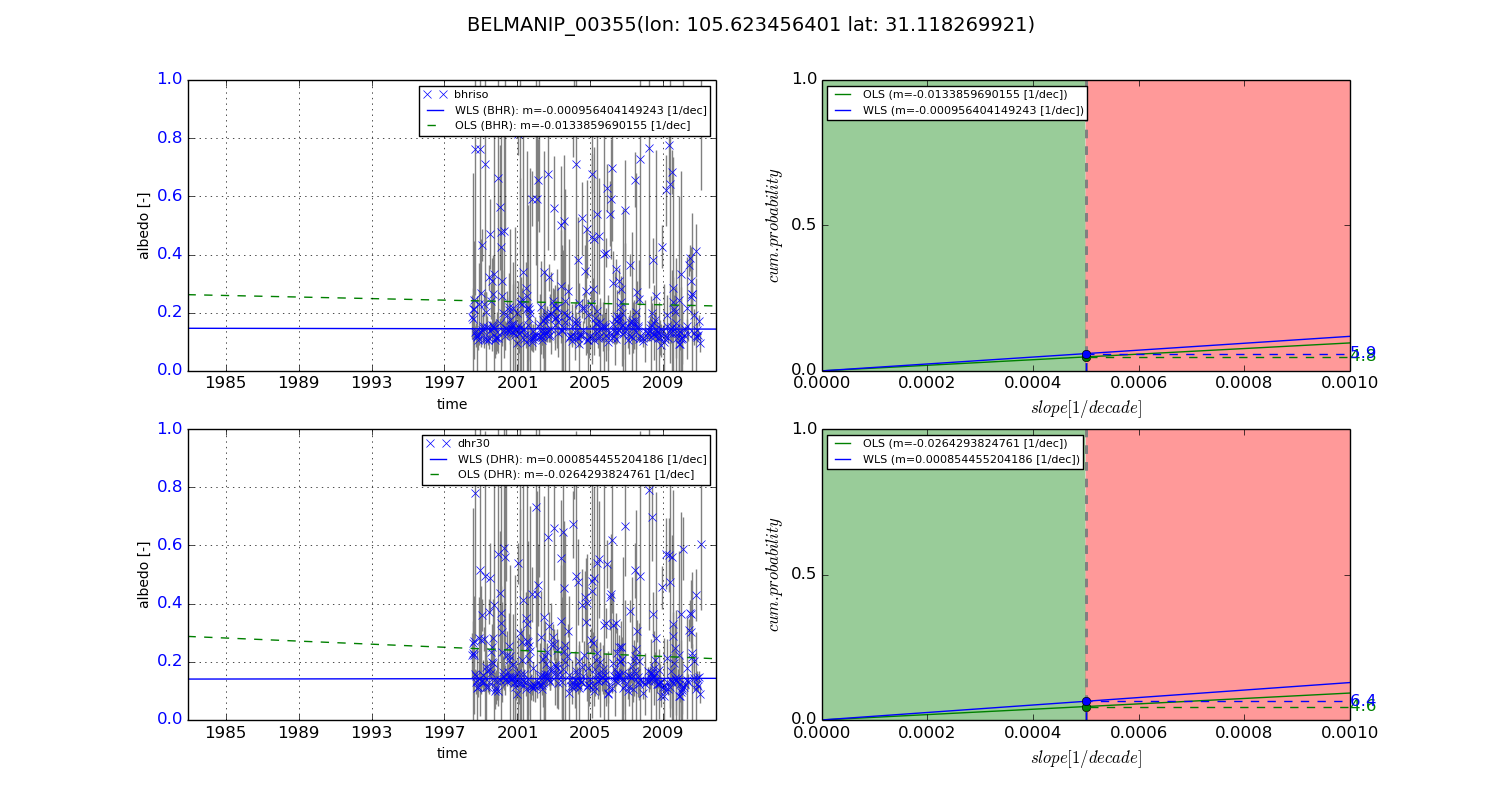
Temporal stability analysis

+000 deg (BHR)


BHR statistics

Temporal stability [1/decade]:


abs

rel


Weighted least square:

None


Ordinary least square:

None


Probabilities that GCOS criteria is met:

Weighted least square:

None %

Ordinary least square:

None %


DHR statistics

Temporal stability [1/decade]:


abs

rel


Weighted least square:

None


Ordinary least square:

None


Probabilities that GCOS criteria is met:

Weighted least square:

None %

Ordinary least square:

None %


+057/+063 deg (BHR)


BHR statistics

Temporal stability [1/decade]:


abs

rel


Weighted least square:

-0.000956404149243


Ordinary least square:

-0.0133859690155


Probabilities that GCOS criteria is met:

Weighted least square:

5.9 %

Ordinary least square:

4.8 %


DHR statistics

Temporal stability [1/decade]:


abs

rel


Weighted least square:

0.000854455204186


Ordinary least square:

-0.0264293824761


Probabilities that GCOS criteria is met:

Weighted least square:

6.4 %

Ordinary least square:

4.6 %


Temporal anomaly analyis

The variance of the temporal anomalies provides an additional measure about the stability of the signal AFTER removal of the mean seasonal cylce.

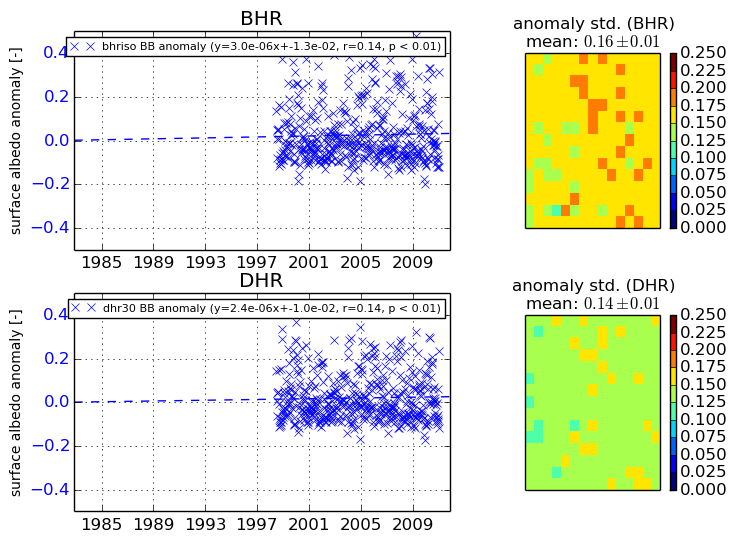
+000 deg


+057/+063 deg