BELMANIP_00359


Location

lon / lat [deg]: 63.4826 / 30.783

Source network: BELMANIP


Geostationary surface albedo (GSA) data


“+000”


“+057/+063”


Landcover information (based on ESA CCI landcover data)


Landcover fractions @ 2km distance


Landcover fractions @ 20 km distance


Legend


Distance to open water bodies [km]:

21.89

Distance to urban areas [km]:

27.07


Radius: 1 km

Number of landcover classes:

1

Dominant landcover type:

200: bare areas

Fraction of dominant landcover type [%]:

100.0


Radius: 2 km

Number of landcover classes:

1

Dominant landcover type:

200: bare areas

Fraction of dominant landcover type [%]:

100.0


Radius: 5 km

Number of landcover classes:

1

Dominant landcover type:

200: bare areas

Fraction of dominant landcover type [%]:

100.0


Radius: 10 km

Number of landcover classes:

1

Dominant landcover type:

200: bare areas

Fraction of dominant landcover type [%]:

100.0


Radius: 20 km

Number of landcover classes:

1

Dominant landcover type:

200: bare areas

Fraction of dominant landcover type [%]:

99.0


Disturbances


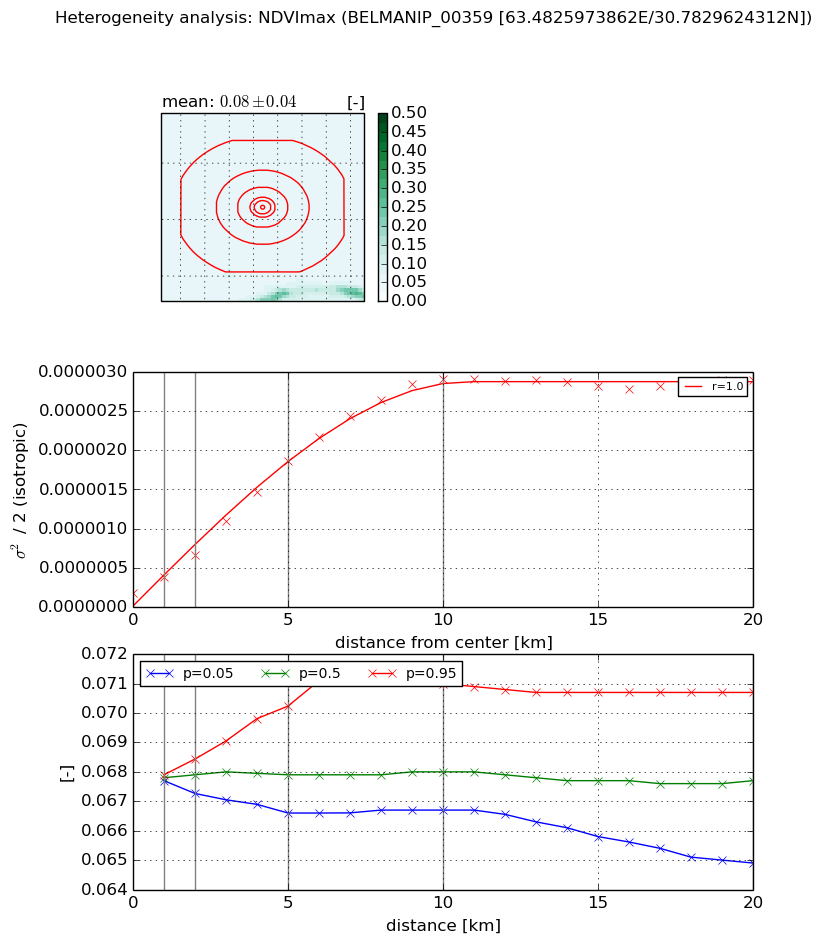
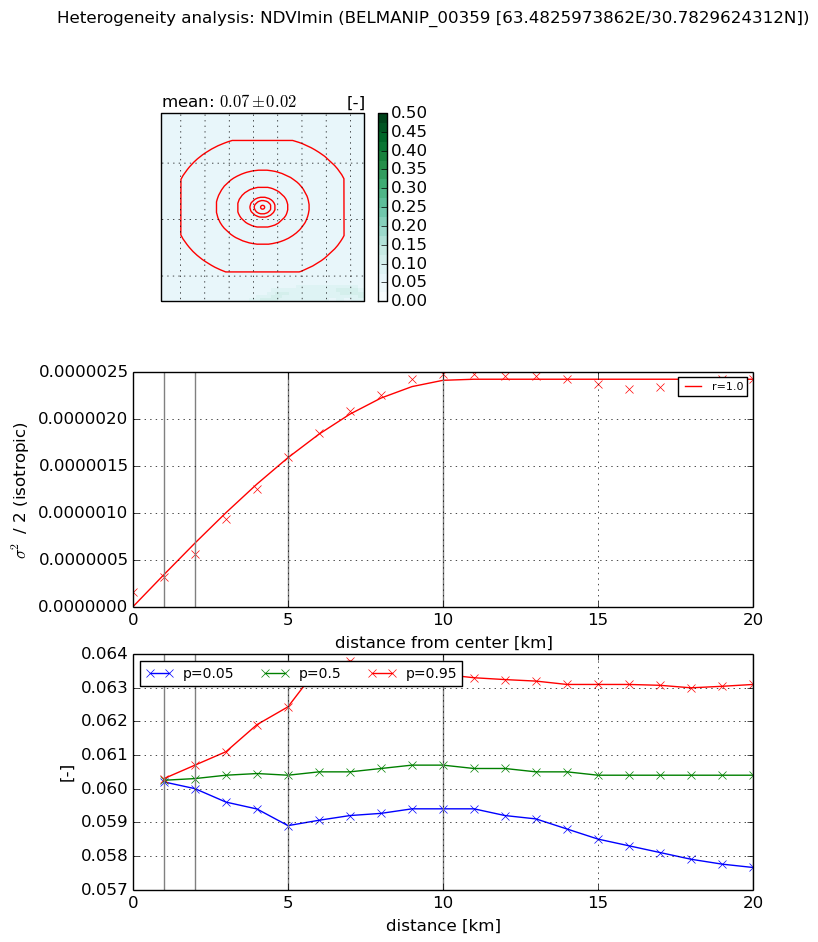
Heterogeneity analysis

The heterogeneity analysis provides information about the spatial and temporal heterogeneity of the site.

Topography


Roman et al. (2009) index


St

0.000167415541542

Rcv

1.23409034737

Rse

0.0

Rst

-0.0248020501289

Rsv

17918.2244027


Height range @ 1km [m]

4

Height range @ 2km [m]

5

Height range @ 5km [m]

13

Height range @ 10km [m]

-999

Height range @ 20km [m]

-999


Variance slope @ 1 km

5

Variance slope @ 2 km

5

Variance slope @ 5 km

4

Variance slope @ 10 km

-999

Variance slope @ 20 km

-999


NDVI (max. NDVI composite)


Roman et al. (2009) index


St

0.975846123015

Rcv

1.01991116653

Rse

0.0

Rst

-1.05434588004

Rsv

-0.999998134909


NDVI range @ 1km [-]

0.0

NDVI range @ 2km [-]

0.0

NDVI range @ 5km [-]

0.0

NDVI range @ 10km [-]

0.0

NDVI range @ 20km [-]

0.01


Variance slope @ 1 km

2.00743392031e-07

Variance slope @ 2 km

2.42456838793e-07

Variance slope @ 5 km

3.45177619803e-07

Variance slope @ 10 km

2.97824600392e-07

Variance slope @ 20 km

1.25630791475e-07


NDVI (min. NDVI composite)I


Roman et al. (2009) index


St

1.22694186773

Rcv

1.30824337655

Rse

0.0

Rst

-0.136862913469

Rsv

-0.999997328085


NDVI range @ 1km [-]

0.0

NDVI range @ 2km [-]

0.0

NDVI range @ 5km [-]

0.0

NDVI range @ 10km [-]

0.0

NDVI range @ 20km [-]

0.01


NDVI slope @ 1 km

1.67118535657e-07

NDVI slope @ 2 km

2.03513427288e-07

NDVI slope @ 5 km

2.96405969207e-07

NDVI slope @ 10 km

2.54173247946e-07

NDVI slope @ 20 km

1.04162650899e-07


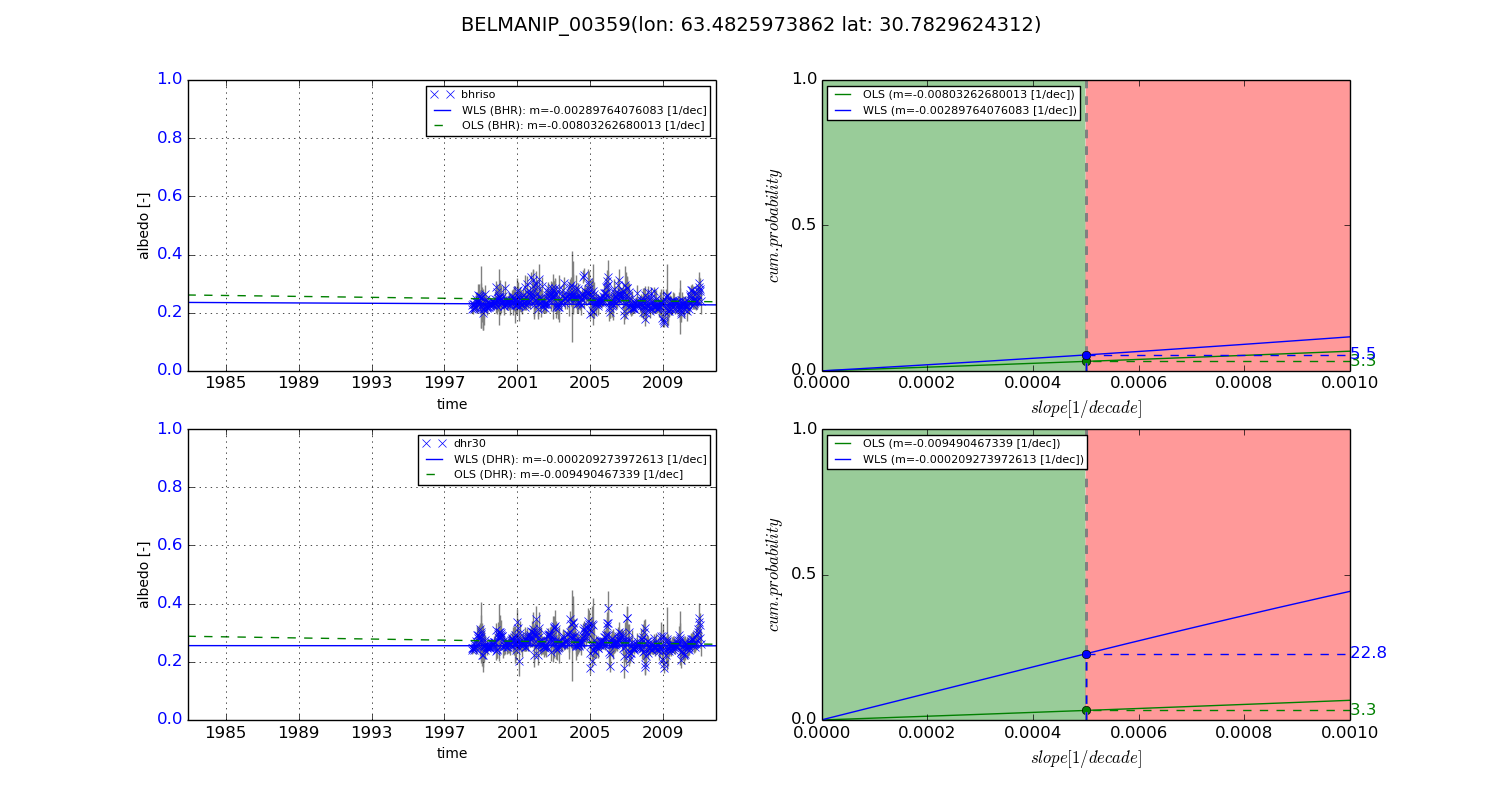
Temporal stability analysis

+000 deg (BHR)


BHR statistics

Temporal stability [1/decade]:


abs

rel


Weighted least square:

-99999.0


Ordinary least square:

-99999.0


Probabilities that GCOS criteria is met:

Weighted least square:

-99999.0 %

Ordinary least square:

-99999.0 %


DHR statistics

Temporal stability [1/decade]:


abs

rel


Weighted least square:

-99999.0


Ordinary least square:

-99999.0


Probabilities that GCOS criteria is met:

Weighted least square:

-99999.0 %

Ordinary least square:

-99999.0 %


+057/+063 deg (BHR)


BHR statistics

Temporal stability [1/decade]:


abs

rel


Weighted least square:

-0.00289764076083


Ordinary least square:

-0.00803262680013


Probabilities that GCOS criteria is met:

Weighted least square:

5.5 %

Ordinary least square:

3.3 %


DHR statistics

Temporal stability [1/decade]:


abs

rel


Weighted least square:

-0.000209273972613


Ordinary least square:

-0.009490467339


Probabilities that GCOS criteria is met:

Weighted least square:

22.8 %

Ordinary least square:

3.3 %


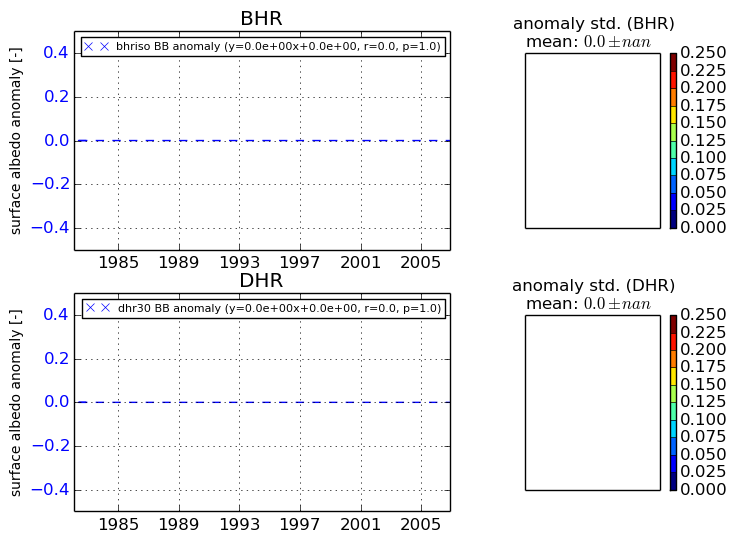
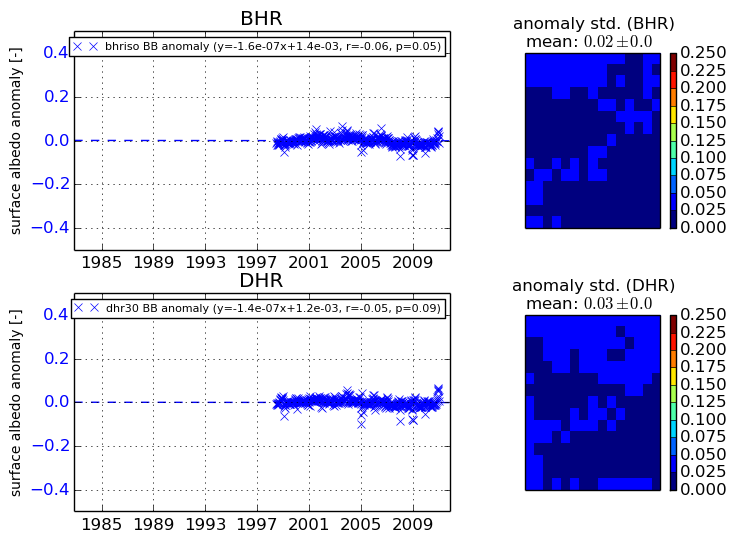
Temporal anomaly analyis

The variance of the temporal anomalies provides an additional measure about the stability of the signal AFTER removal of the mean seasonal cylce.
+000 deg


+057/+063 deg