BELMANIP_00360


Location

lon / lat [deg]: 79.109 / 38.1597

Source network: BELMANIP


Geostationary surface albedo (GSA) data


“+000”


“+057/+063”


Landcover information (based on ESA CCI landcover data)


Landcover fractions @ 2km distance


Landcover fractions @ 20 km distance


Legend


Distance to open water bodies [km]:

none in region

Distance to urban areas [km]:

none in region


Radius: 1 km

Number of landcover classes:

2

Dominant landcover type:

202: unknown

Fraction of dominant landcover type [%]:

60.0


Radius: 2 km

Number of landcover classes:

2

Dominant landcover type:

202: unknown

Fraction of dominant landcover type [%]:

69.0


Radius: 5 km

Number of landcover classes:

2

Dominant landcover type:

202: unknown

Fraction of dominant landcover type [%]:

68.0


Radius: 10 km

Number of landcover classes:

2

Dominant landcover type:

202: unknown

Fraction of dominant landcover type [%]:

59.0


Radius: 20 km

Number of landcover classes:

2

Dominant landcover type:

200: bare areas

Fraction of dominant landcover type [%]:

53.0


Disturbances


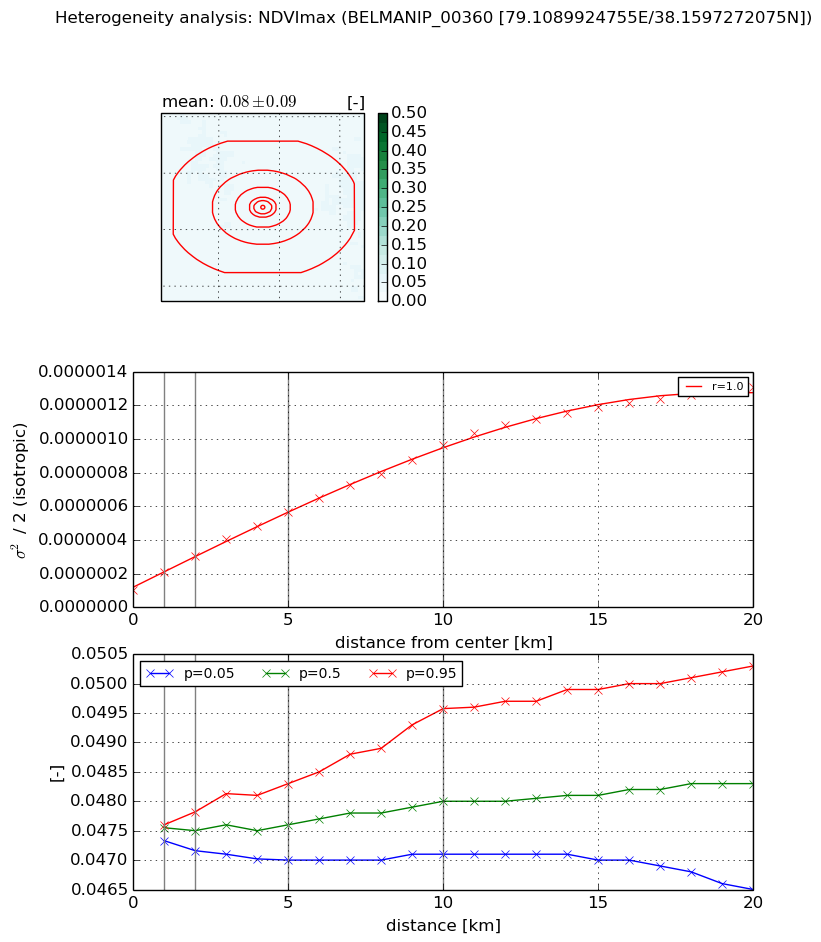
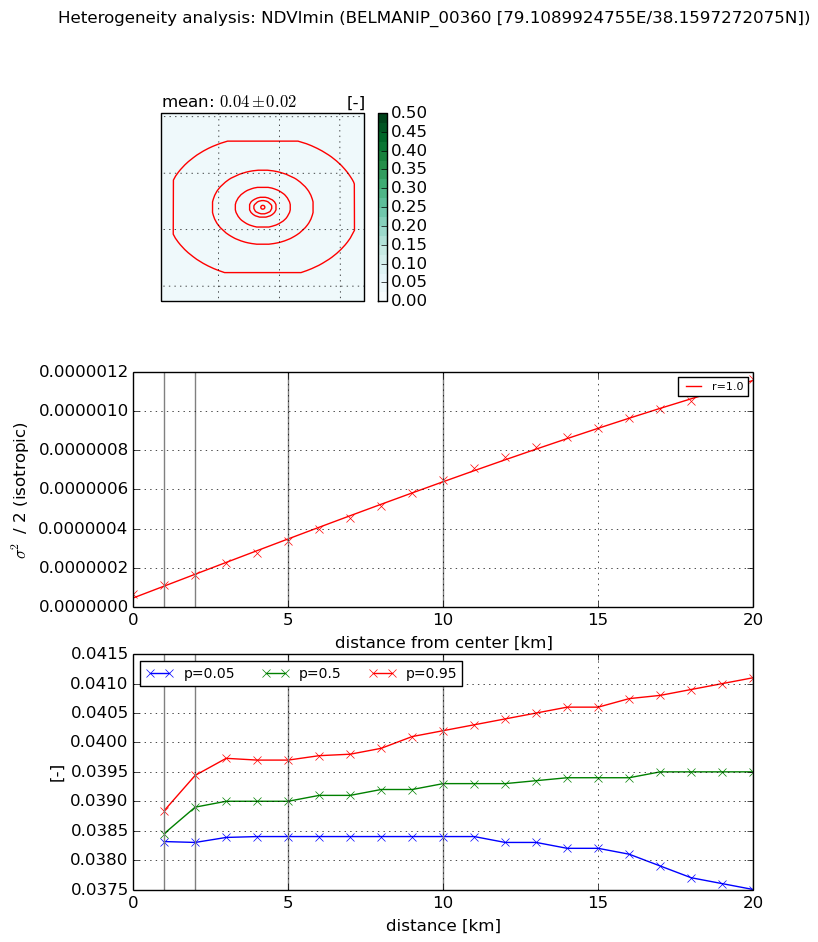
Heterogeneity analysis

The heterogeneity analysis provides information about the spatial and temporal heterogeneity of the site.

Topography


Roman et al. (2009) index


St

72.5349986654

Rcv

-0.0268311167033

Rse

0.0

Rst

-0.00117386508573

Rsv

0.013354362737


Height range @ 1km [m]

34

Height range @ 2km [m]

34

Height range @ 5km [m]

37

Height range @ 10km [m]

-999

Height range @ 20km [m]

-999


Variance slope @ 1 km

152

Variance slope @ 2 km

43

Variance slope @ 5 km

8

Variance slope @ 10 km

-999

Variance slope @ 20 km

-999


NDVI (max. NDVI composite)


Roman et al. (2009) index


St

1.07856040814

Rcv

0.268409186271

Rse

0.0

Rst

-0.465130147616

Rsv

2.04794603991


NDVI range @ 1km [-]

0.0

NDVI range @ 2km [-]

0.0

NDVI range @ 5km [-]

0.0

NDVI range @ 10km [-]

0.0

NDVI range @ 20km [-]

0.0


Variance slope @ 1 km

1.04514359904e-07

Variance slope @ 2 km

9.93376859815e-08

Variance slope @ 5 km

9.30804245168e-08

Variance slope @ 10 km

8.43439742727e-08

Variance slope @ 20 km

6.06173992221e-08


NDVI (min. NDVI composite)I


Roman et al. (2009) index


St

15.6702188557

Rcv

-0.0785103436136

Rse

0.0

Rst

0.0718243067334

Rsv

-0.0411113037663


NDVI range @ 1km [-]

0.0

NDVI range @ 2km [-]

0.0

NDVI range @ 5km [-]

0.0

NDVI range @ 10km [-]

0.0

NDVI range @ 20km [-]

0.0


NDVI slope @ 1 km

5.01090230331e-08

NDVI slope @ 2 km

4.87444645553e-08

NDVI slope @ 5 km

5.44337997716e-08

NDVI slope @ 10 km

5.83105950636e-08

NDVI slope @ 20 km

5.59079221195e-08


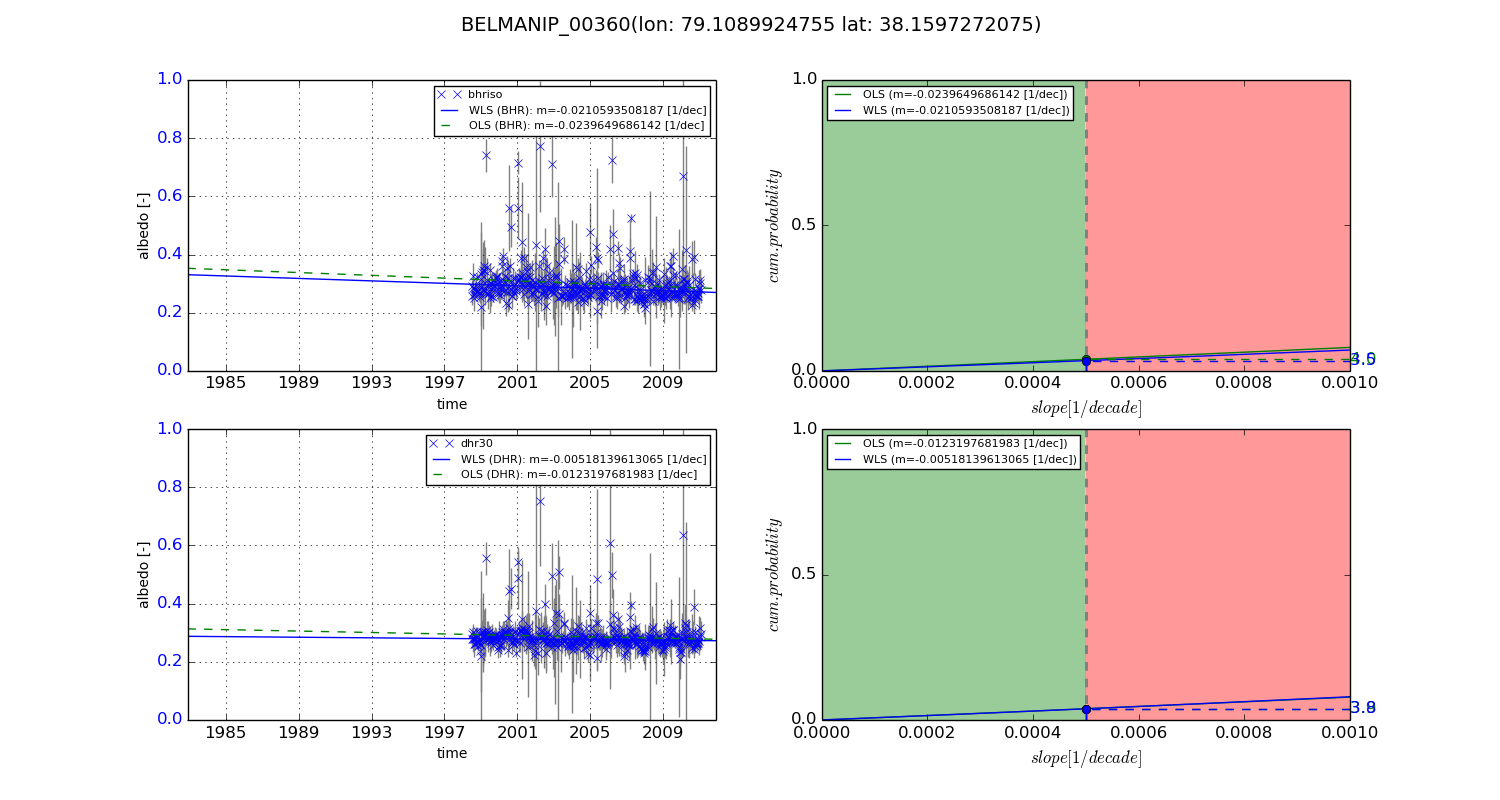
Temporal stability analysis

+000 deg (BHR)


BHR statistics

Temporal stability [1/decade]:


abs

rel


Weighted least square:

None


Ordinary least square:

None


Probabilities that GCOS criteria is met:

Weighted least square:

None %

Ordinary least square:

None %


DHR statistics

Temporal stability [1/decade]:


abs

rel


Weighted least square:

None


Ordinary least square:

None


Probabilities that GCOS criteria is met:

Weighted least square:

None %

Ordinary least square:

None %


+057/+063 deg (BHR)


BHR statistics

Temporal stability [1/decade]:


abs

rel


Weighted least square:

-0.0210593508187


Ordinary least square:

-0.0239649686142


Probabilities that GCOS criteria is met:

Weighted least square:

3.5 %

Ordinary least square:

4.0 %


DHR statistics

Temporal stability [1/decade]:


abs

rel


Weighted least square:

-0.00518139613065


Ordinary least square:

-0.0123197681983


Probabilities that GCOS criteria is met:

Weighted least square:

3.8 %

Ordinary least square:

3.9 %


Temporal anomaly analyis

The variance of the temporal anomalies provides an additional measure about the stability of the signal AFTER removal of the mean seasonal cylce.

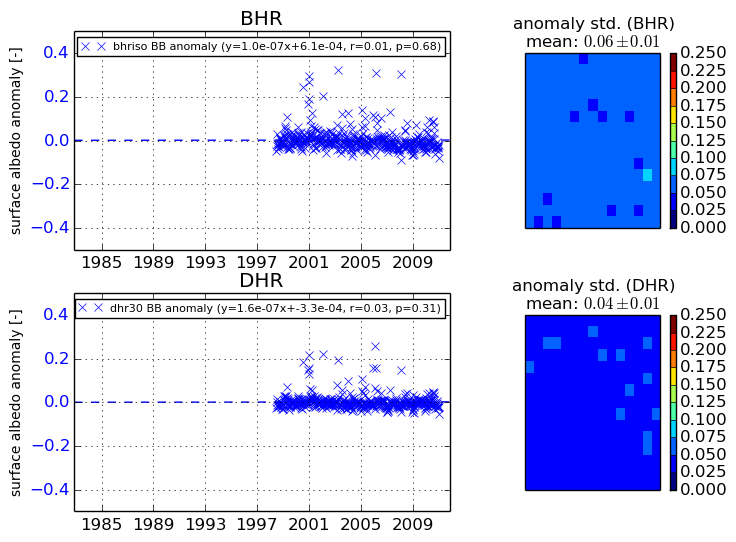
+000 deg


+057/+063 deg