BELMANIP_00366


Location

lon / lat [deg]: 108.6479 / 42.0571

Source network: BELMANIP


Geostationary surface albedo (GSA) data


“+000”


“+057/+063”


Landcover information (based on ESA CCI landcover data)


Landcover fractions @ 2km distance


Landcover fractions @ 20 km distance


Legend


Distance to open water bodies [km]:

46.27

Distance to urban areas [km]:

53.4


Radius: 1 km

Number of landcover classes:

1

Dominant landcover type:

200: bare areas

Fraction of dominant landcover type [%]:

100.0


Radius: 2 km

Number of landcover classes:

1

Dominant landcover type:

200: bare areas

Fraction of dominant landcover type [%]:

100.0


Radius: 5 km

Number of landcover classes:

1

Dominant landcover type:

200: bare areas

Fraction of dominant landcover type [%]:

100.0


Radius: 10 km

Number of landcover classes:

1

Dominant landcover type:

200: bare areas

Fraction of dominant landcover type [%]:

99.0


Radius: 20 km

Number of landcover classes:

1

Dominant landcover type:

200: bare areas

Fraction of dominant landcover type [%]:

99.0


Disturbances


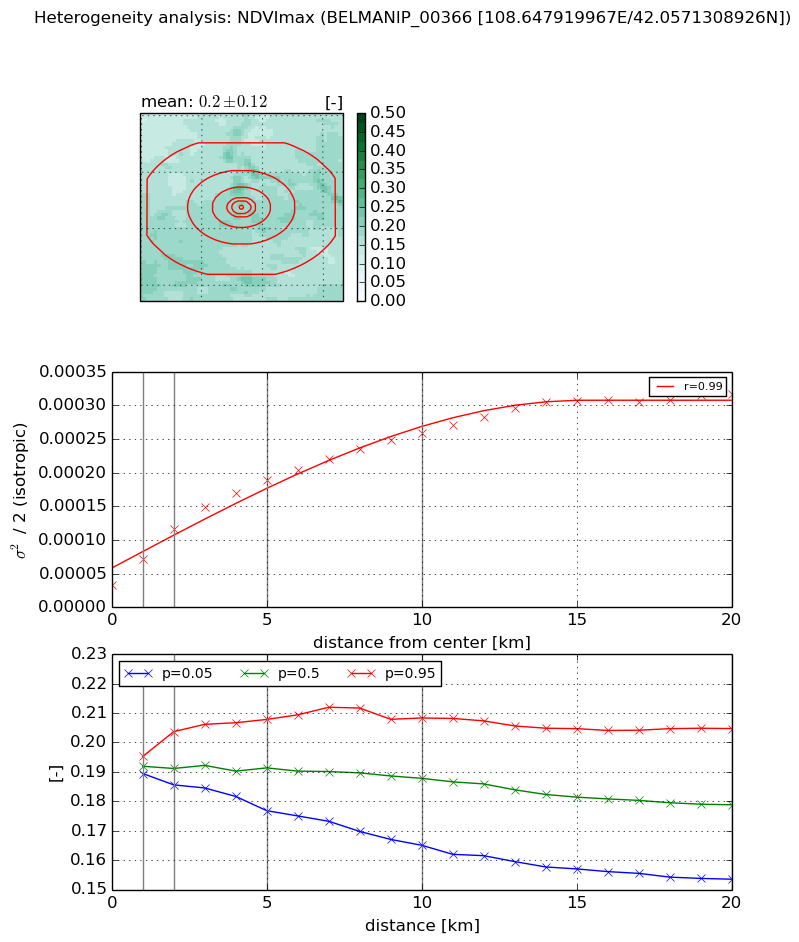
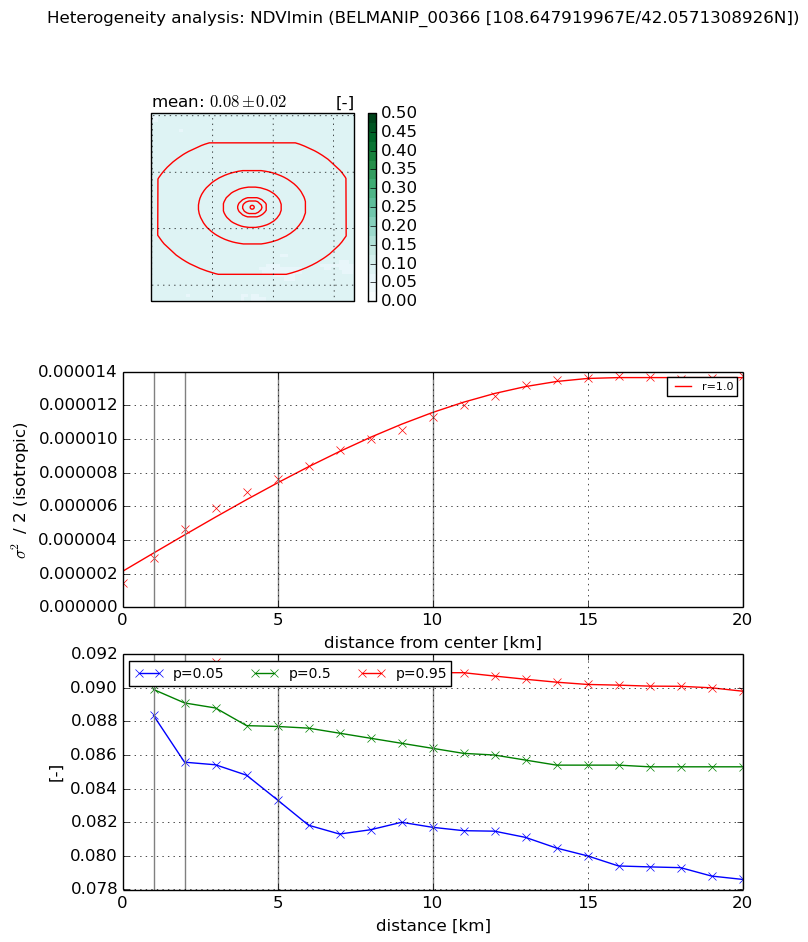
Heterogeneity analysis

The heterogeneity analysis provides information about the spatial and temporal heterogeneity of the site.

Topography


Roman et al. (2009) index


St

2.32875349103

Rcv

0.414719478655

Rse

0.0

Rst

3.15879329671e-06

Rsv

0.873520197851


Height range @ 1km [m]

29

Height range @ 2km [m]

50

Height range @ 5km [m]

90

Height range @ 10km [m]

-999

Height range @ 20km [m]

-999


Variance slope @ 1 km

53

Variance slope @ 2 km

74

Variance slope @ 5 km

147

Variance slope @ 10 km

-999

Variance slope @ 20 km

-999


NDVI (max. NDVI composite)


Roman et al. (2009) index


St

3.04039978993

Rcv

0.162245802696

Rse

0.0

Rst

-1.5949178423e-08

Rsv

-0.824466524231


NDVI range @ 1km [-]

0.01

NDVI range @ 2km [-]

0.02

NDVI range @ 5km [-]

0.03

NDVI range @ 10km [-]

0.04

NDVI range @ 20km [-]

0.05


Variance slope @ 1 km

3.84591589653e-05

Variance slope @ 2 km

4.1811835969e-05

Variance slope @ 5 km

3.16430400217e-05

Variance slope @ 10 km

2.15431780898e-05

Variance slope @ 20 km

1.27615456544e-05


NDVI (min. NDVI composite)I


Roman et al. (2009) index


St

1.88127959003

Rcv

0.217485815026

Rse

0.0

Rst

-0.377173974541

Rsv

-0.999999513549


NDVI range @ 1km [-]

0.0

NDVI range @ 2km [-]

0.01

NDVI range @ 5km [-]

0.01

NDVI range @ 10km [-]

0.01

NDVI range @ 20km [-]

0.01


NDVI slope @ 1 km

1.5067539233e-06

NDVI slope @ 2 km

1.62746306897e-06

NDVI slope @ 5 km

1.25834189279e-06

NDVI slope @ 10 km

9.48332820121e-07

NDVI slope @ 20 km

5.91556255184e-07


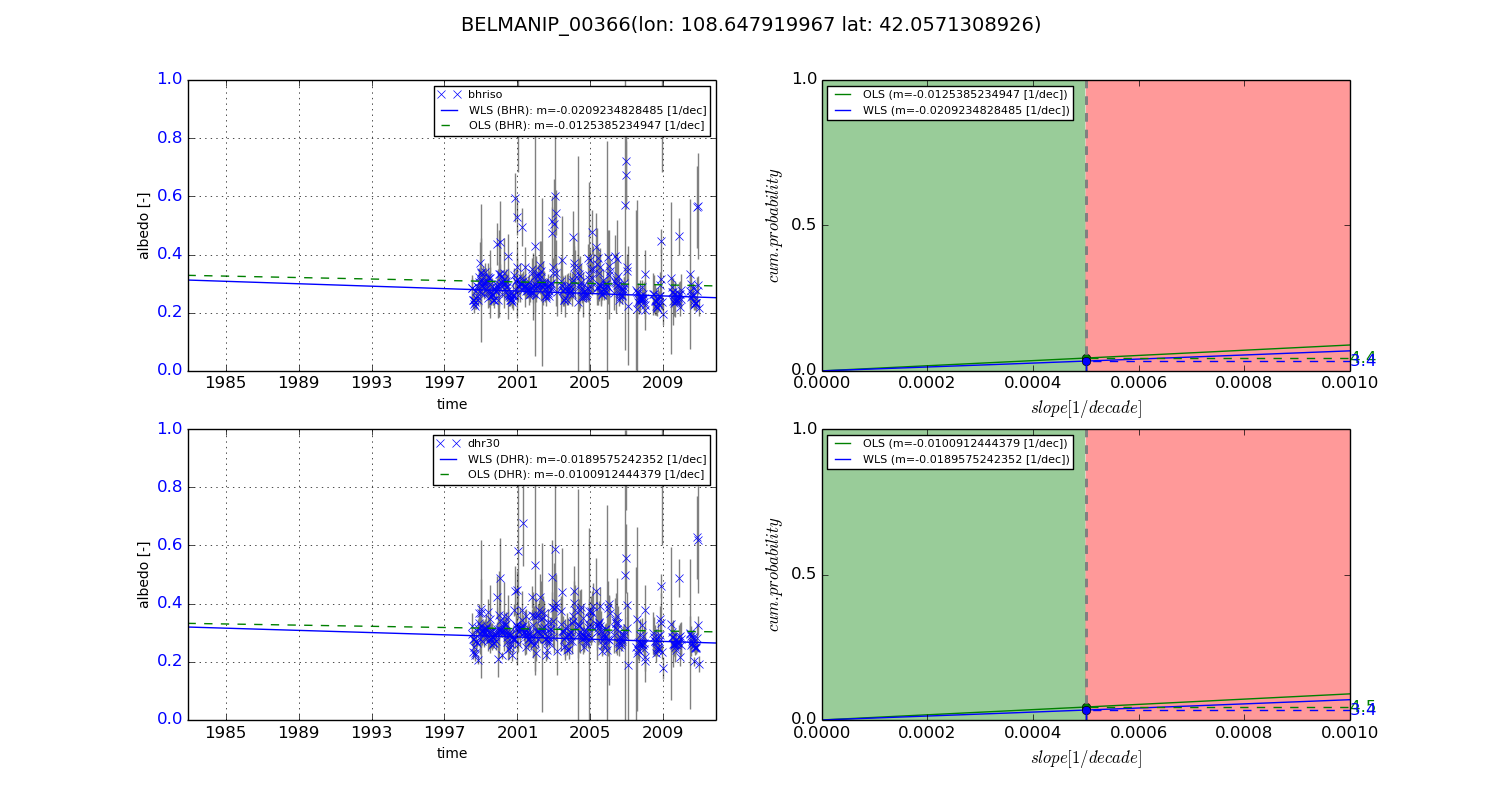
Temporal stability analysis

+000 deg (BHR)


BHR statistics

Temporal stability [1/decade]:


abs

rel


Weighted least square:

None


Ordinary least square:

None


Probabilities that GCOS criteria is met:

Weighted least square:

None %

Ordinary least square:

None %


DHR statistics

Temporal stability [1/decade]:


abs

rel


Weighted least square:

None


Ordinary least square:

None


Probabilities that GCOS criteria is met:

Weighted least square:

None %

Ordinary least square:

None %


+057/+063 deg (BHR)


BHR statistics

Temporal stability [1/decade]:


abs

rel


Weighted least square:

-0.0209234828485


Ordinary least square:

-0.0125385234947


Probabilities that GCOS criteria is met:

Weighted least square:

3.4 %

Ordinary least square:

4.4 %


DHR statistics

Temporal stability [1/decade]:


abs

rel


Weighted least square:

-0.0189575242352


Ordinary least square:

-0.0100912444379


Probabilities that GCOS criteria is met:

Weighted least square:

3.4 %

Ordinary least square:

4.5 %


Temporal anomaly analyis

The variance of the temporal anomalies provides an additional measure about the stability of the signal AFTER removal of the mean seasonal cylce.

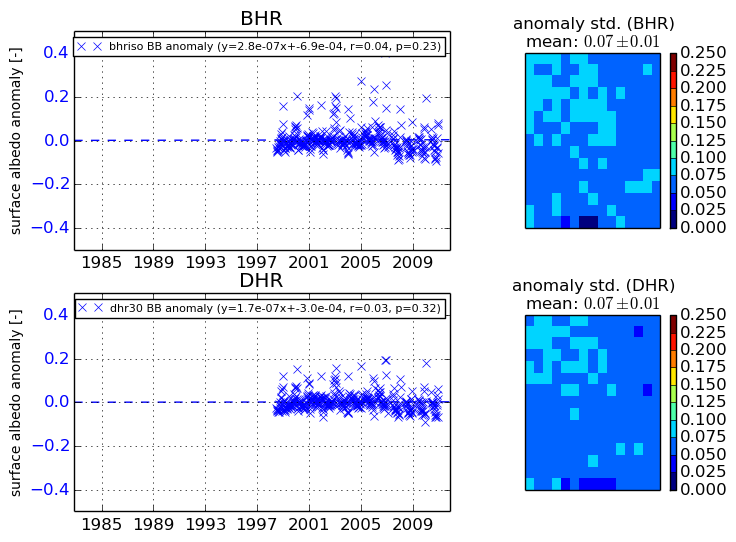
+000 deg


+057/+063 deg