BELMANIP_00367


Location

lon / lat [deg]: 115.4026 / 42.208

Source network: BELMANIP


Geostationary surface albedo (GSA) data


“+000”


“+057/+063”


Landcover information (based on ESA CCI landcover data)


Landcover fractions @ 2km distance


Landcover fractions @ 20 km distance


Legend


Distance to open water bodies [km]:

9.72

Distance to urban areas [km]:

24.95


Radius: 1 km

Number of landcover classes:

2

Dominant landcover type:

130: grassland

Fraction of dominant landcover type [%]:

95.0


Radius: 2 km

Number of landcover classes:

3

Dominant landcover type:

130: grassland

Fraction of dominant landcover type [%]:

91.0


Radius: 5 km

Number of landcover classes:

3

Dominant landcover type:

130: grassland

Fraction of dominant landcover type [%]:

94.0


Radius: 10 km

Number of landcover classes:

3

Dominant landcover type:

130: grassland

Fraction of dominant landcover type [%]:

91.0


Radius: 20 km

Number of landcover classes:

3

Dominant landcover type:

130: grassland

Fraction of dominant landcover type [%]:

87.0


Disturbances


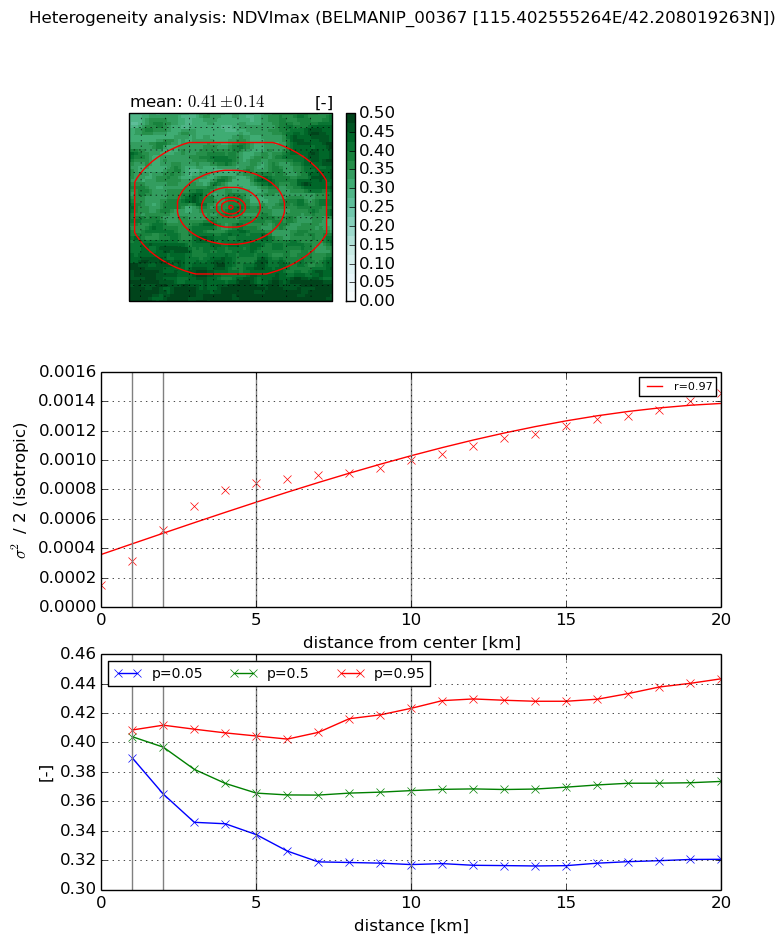
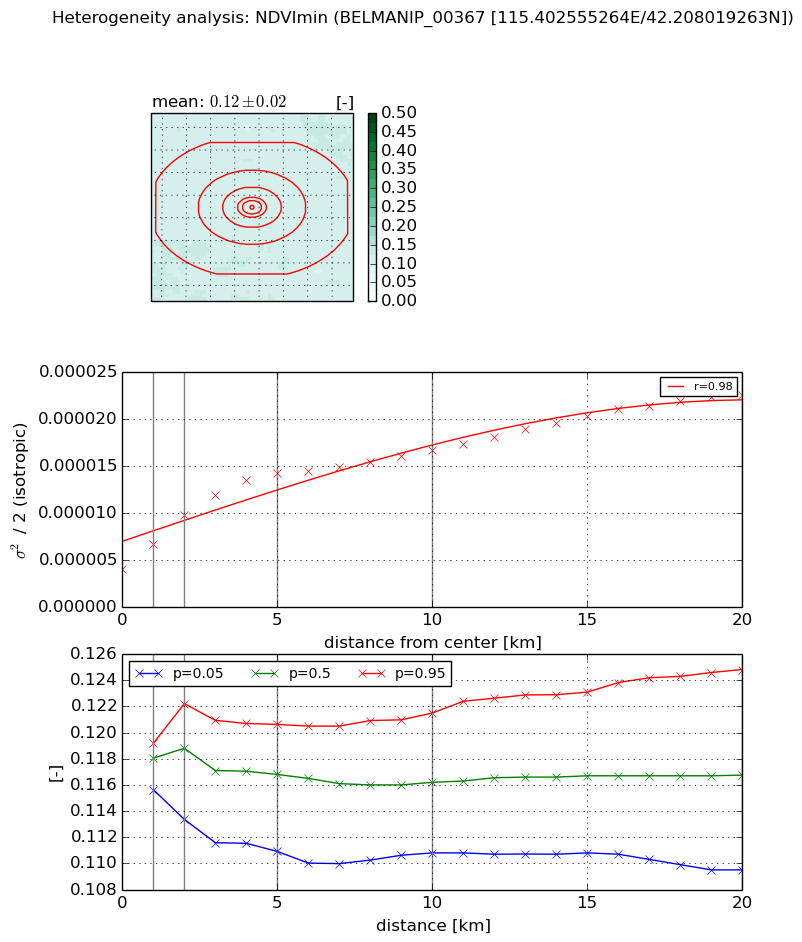
Heterogeneity analysis

The heterogeneity analysis provides information about the spatial and temporal heterogeneity of the site.

Topography


Roman et al. (2009) index


St

25.1827719645

Rcv

0.0413006934422

Rse

0.0

Rst

0.011724249404

Rsv

0.0661041190468


Height range @ 1km [m]

124

Height range @ 2km [m]

163

Height range @ 5km [m]

169

Height range @ 10km [m]

-999

Height range @ 20km [m]

-999


Variance slope @ 1 km

879

Variance slope @ 2 km

895

Variance slope @ 5 km

692

Variance slope @ 10 km

-999

Variance slope @ 20 km

-999


NDVI (max. NDVI composite)


Roman et al. (2009) index


St

nan

Rcv

nan

Rse

nan

Rst

nan

Rsv

nan


NDVI range @ 1km [-]

0.02

NDVI range @ 2km [-]

0.05

NDVI range @ 5km [-]

0.07

NDVI range @ 10km [-]

0.11

NDVI range @ 20km [-]

0.12


Variance slope @ 1 km

0.000162215403494

Variance slope @ 2 km

0.000186275385837

Variance slope @ 5 km

0.00014483969145

Variance slope @ 10 km

7.63088033973e-05

Variance slope @ 20 km

5.31430371372e-05


NDVI (min. NDVI composite)I


Roman et al. (2009) index


St

11.8379141206

Rcv

0.101036510869

Rse

0.0

Rst

-0.0727382045284

Rsv

-0.0796483090839


NDVI range @ 1km [-]

0.0

NDVI range @ 2km [-]

0.01

NDVI range @ 5km [-]

0.01

NDVI range @ 10km [-]

0.01

NDVI range @ 20km [-]

0.02


NDVI slope @ 1 km

2.68760084534e-06

NDVI slope @ 2 km

2.84748231767e-06

NDVI slope @ 5 km

2.09022921972e-06

NDVI slope @ 10 km

1.13039224233e-06

NDVI slope @ 20 km

7.82503803173e-07


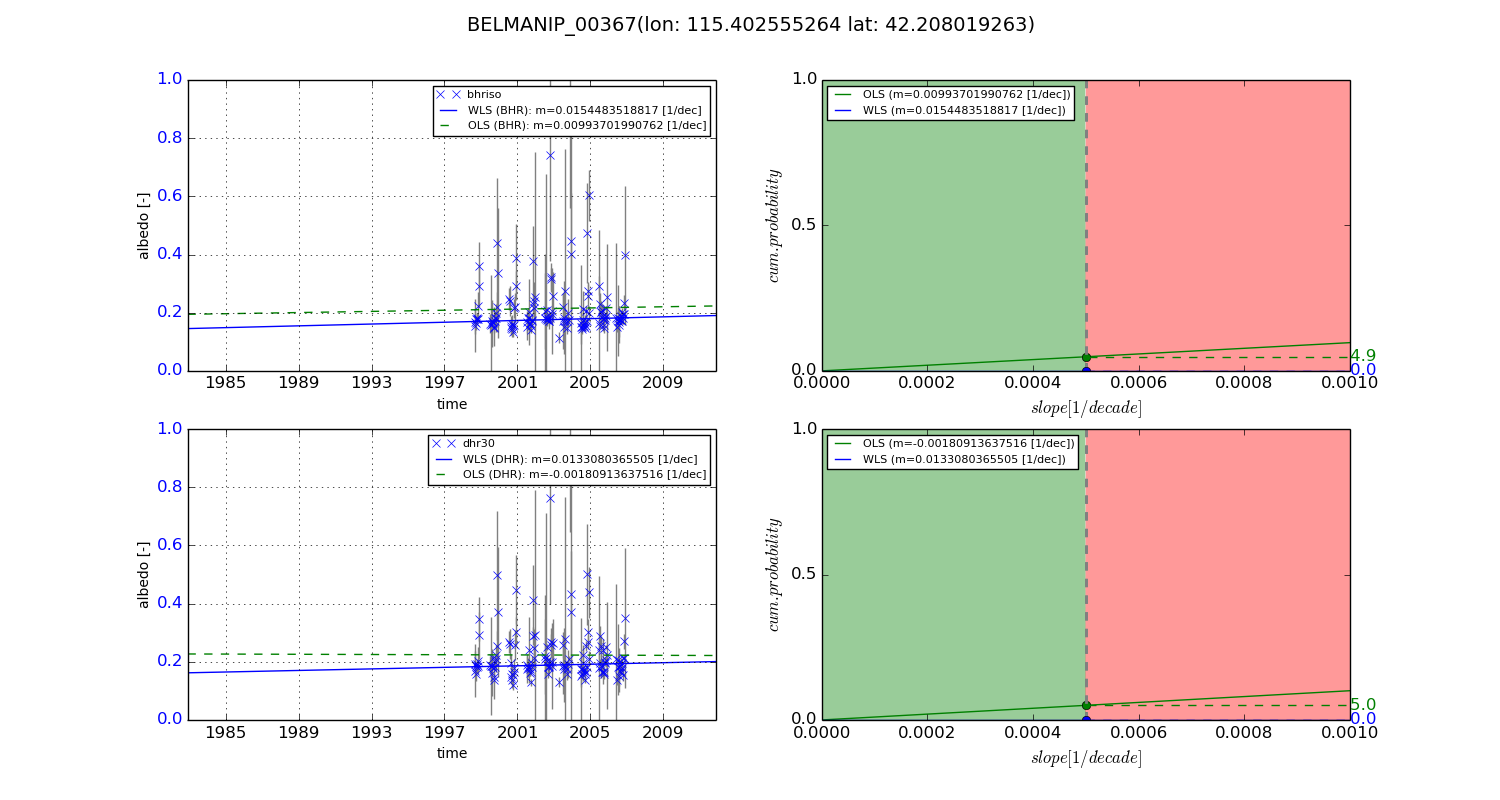
Temporal stability analysis

+000 deg (BHR)


BHR statistics

Temporal stability [1/decade]:


abs

rel


Weighted least square:

None


Ordinary least square:

None


Probabilities that GCOS criteria is met:

Weighted least square:

None %

Ordinary least square:

None %


DHR statistics

Temporal stability [1/decade]:


abs

rel


Weighted least square:

None


Ordinary least square:

None


Probabilities that GCOS criteria is met:

Weighted least square:

None %

Ordinary least square:

None %


+057/+063 deg (BHR)


BHR statistics

Temporal stability [1/decade]:


abs

rel


Weighted least square:

0.0154483518817


Ordinary least square:

0.00993701990762


Probabilities that GCOS criteria is met:

Weighted least square:

0.0 %

Ordinary least square:

4.9 %


DHR statistics

Temporal stability [1/decade]:


abs

rel


Weighted least square:

0.0133080365505


Ordinary least square:

-0.00180913637516


Probabilities that GCOS criteria is met:

Weighted least square:

0.0 %

Ordinary least square:

5.0 %


Temporal anomaly analyis

The variance of the temporal anomalies provides an additional measure about the stability of the signal AFTER removal of the mean seasonal cylce.

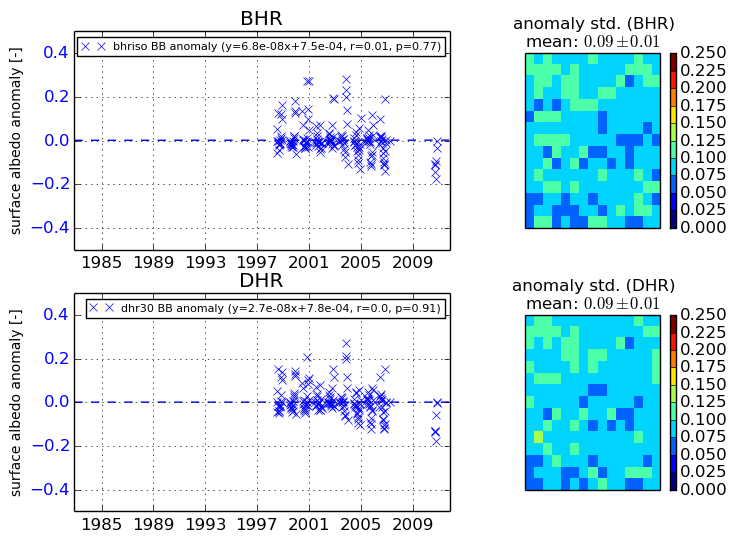
+000 deg


+057/+063 deg