BELMANIP_00368


Location

lon / lat [deg]: 68.2209 / 49.7357

Source network: BELMANIP


Geostationary surface albedo (GSA) data


“+000”


“+057/+063”


Landcover information (based on ESA CCI landcover data)


Landcover fractions @ 2km distance


Landcover fractions @ 20 km distance


Legend


Distance to open water bodies [km]:

12.37

Distance to urban areas [km]:

none in region


Radius: 1 km

Number of landcover classes:

2

Dominant landcover type:

200: bare areas

Fraction of dominant landcover type [%]:

56.0


Radius: 2 km

Number of landcover classes:

2

Dominant landcover type:

130: grassland

Fraction of dominant landcover type [%]:

58.0


Radius: 5 km

Number of landcover classes:

2

Dominant landcover type:

130: grassland

Fraction of dominant landcover type [%]:

80.0


Radius: 10 km

Number of landcover classes:

2

Dominant landcover type:

130: grassland

Fraction of dominant landcover type [%]:

89.0


Radius: 20 km

Number of landcover classes:

2

Dominant landcover type:

130: grassland

Fraction of dominant landcover type [%]:

89.0


Disturbances


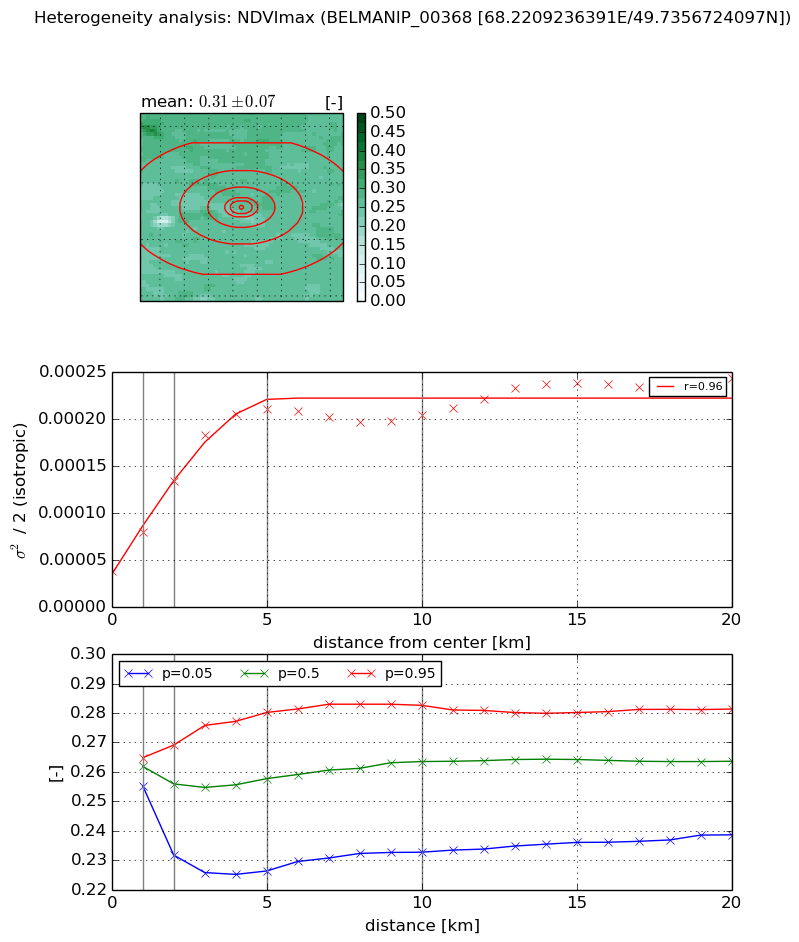
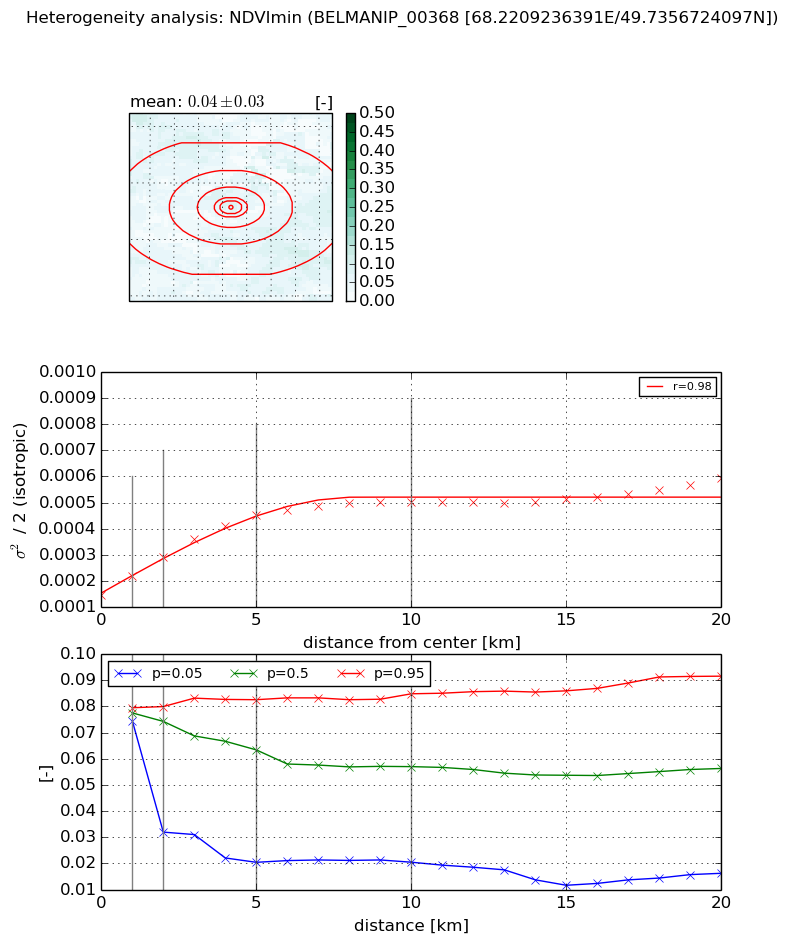
Heterogeneity analysis

The heterogeneity analysis provides information about the spatial and temporal heterogeneity of the site.

Topography


Roman et al. (2009) index


St

8.78159839847

Rcv

0.0740710220675

Rse

0.0

Rst

0.0512236196162

Rsv

-0.216328814989


Height range @ 1km [m]

31

Height range @ 2km [m]

45

Height range @ 5km [m]

59

Height range @ 10km [m]

-999

Height range @ 20km [m]

-999


Variance slope @ 1 km

70

Variance slope @ 2 km

105

Variance slope @ 5 km

101

Variance slope @ 10 km

-999

Variance slope @ 20 km

-999


NDVI (max. NDVI composite)


Roman et al. (2009) index


St

1.59807764084e-07

Rcv

0.0234246738542

Rse

0.0

Rst

0.183049164093

Rsv

18772554.5388


NDVI range @ 1km [-]

0.01

NDVI range @ 2km [-]

0.04

NDVI range @ 5km [-]

0.05

NDVI range @ 10km [-]

0.05

NDVI range @ 20km [-]

0.04


Variance slope @ 1 km

4.14679335013e-05

Variance slope @ 2 km

4.77474575094e-05

Variance slope @ 5 km

3.67908341441e-05

Variance slope @ 10 km

1.39583924566e-05

Variance slope @ 20 km

6.81737346643e-06


NDVI (min. NDVI composite)I


Roman et al. (2009) index


St

2.83706800216

Rcv

0.639354913313

Rse

0.0

Rst

-0.122167986965

Rsv

0.295906811565


NDVI range @ 1km [-]

0.0

NDVI range @ 2km [-]

0.05

NDVI range @ 5km [-]

0.06

NDVI range @ 10km [-]

0.06

NDVI range @ 20km [-]

0.08


NDVI slope @ 1 km

7.26051603464e-05

NDVI slope @ 2 km

7.30994694412e-05

NDVI slope @ 5 km

6.2479166069e-05

NDVI slope @ 10 km

3.5104013533e-05

NDVI slope @ 20 km

1.56328178659e-05


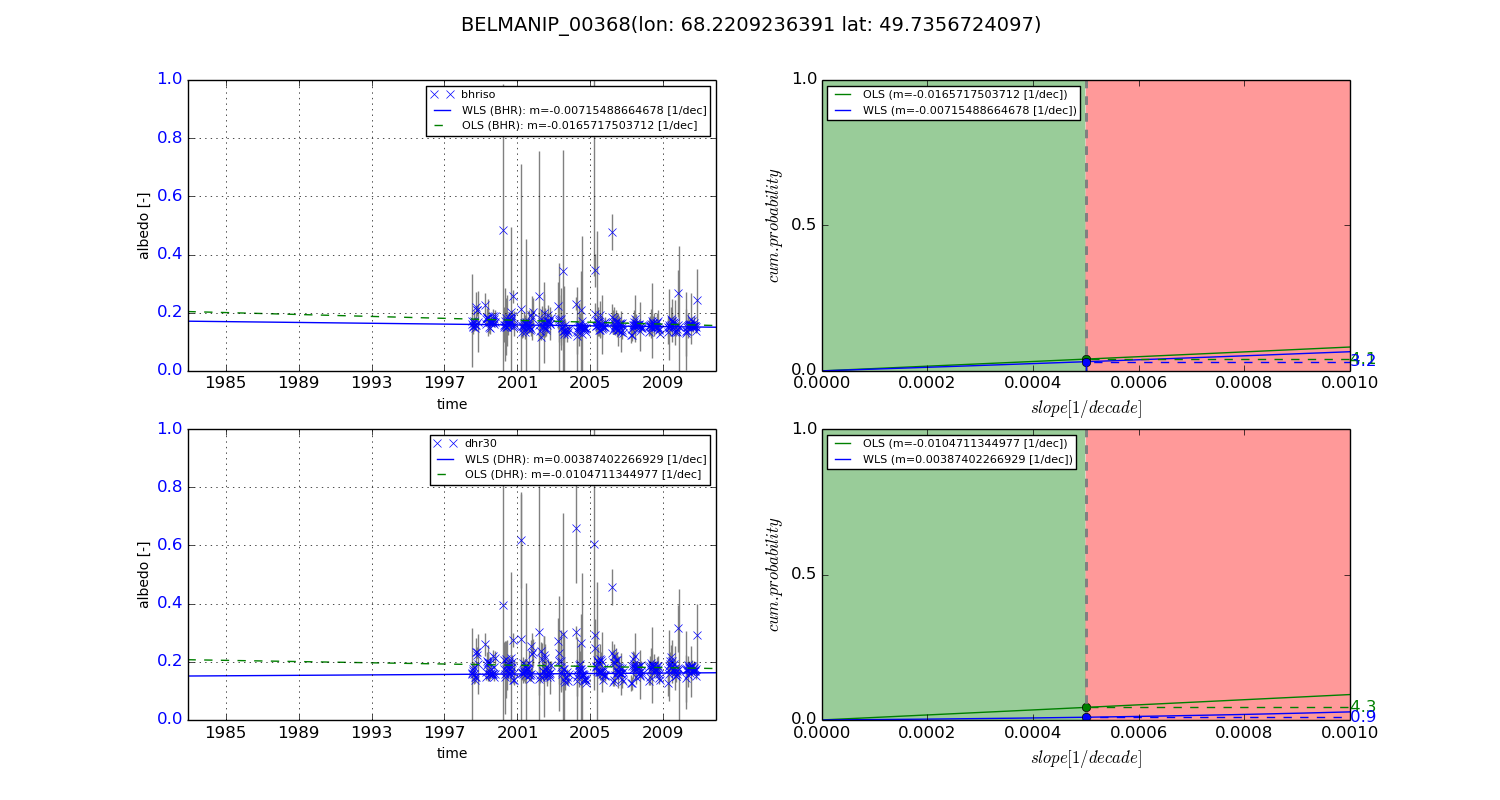
Temporal stability analysis

+000 deg (BHR)


BHR statistics

Temporal stability [1/decade]:


abs

rel


Weighted least square:

-99999.0


Ordinary least square:

-99999.0


Probabilities that GCOS criteria is met:

Weighted least square:

-99999.0 %

Ordinary least square:

-99999.0 %


DHR statistics

Temporal stability [1/decade]:


abs

rel


Weighted least square:

-99999.0


Ordinary least square:

-99999.0


Probabilities that GCOS criteria is met:

Weighted least square:

-99999.0 %

Ordinary least square:

-99999.0 %


+057/+063 deg (BHR)


BHR statistics

Temporal stability [1/decade]:


abs

rel


Weighted least square:

-0.00715488664678


Ordinary least square:

-0.0165717503712


Probabilities that GCOS criteria is met:

Weighted least square:

3.2 %

Ordinary least square:

4.1 %


DHR statistics

Temporal stability [1/decade]:


abs

rel


Weighted least square:

0.00387402266929


Ordinary least square:

-0.0104711344977


Probabilities that GCOS criteria is met:

Weighted least square:

0.9 %

Ordinary least square:

4.3 %


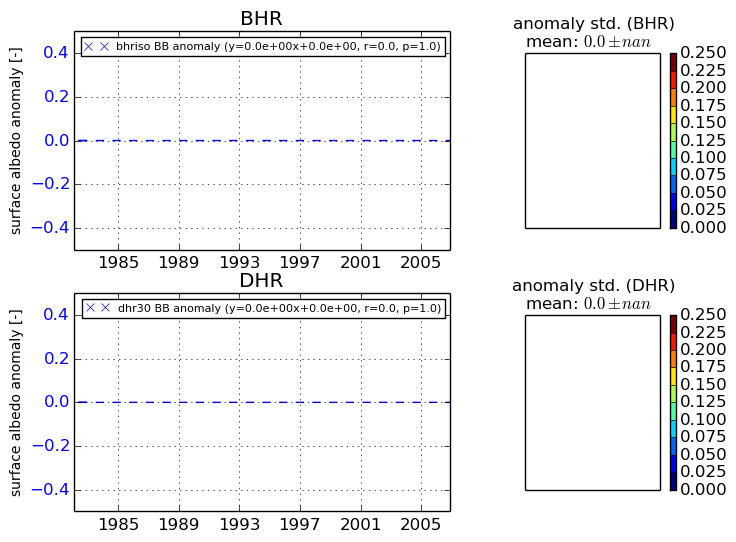
Temporal anomaly analyis

The variance of the temporal anomalies provides an additional measure about the stability of the signal AFTER removal of the mean seasonal cylce.
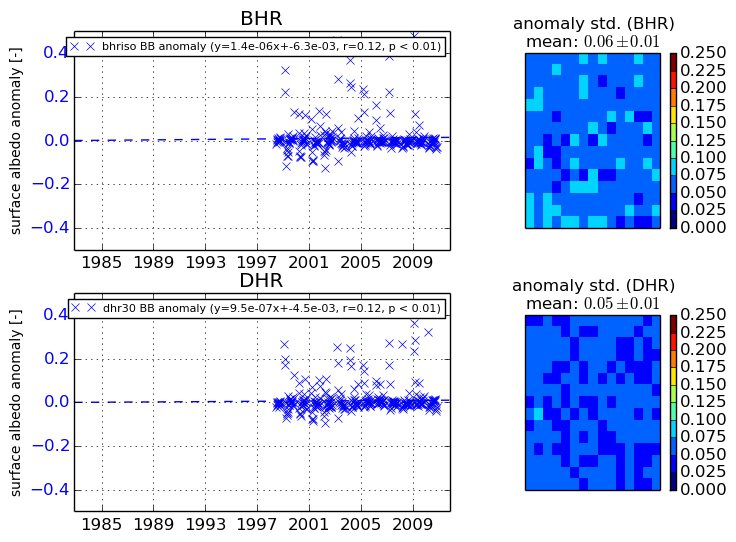
+000 deg


+057/+063 deg