BELMANIP_00371


Location

lon / lat [deg]: 111.0675 / 42.2416

Source network: BELMANIP


Geostationary surface albedo (GSA) data


“+000”


“+057/+063”


Landcover information (based on ESA CCI landcover data)


Landcover fractions @ 2km distance


Landcover fractions @ 20 km distance


Legend


Distance to open water bodies [km]:

9.19

Distance to urban areas [km]:

54.89


Radius: 1 km

Number of landcover classes:

1

Dominant landcover type:

200: bare areas

Fraction of dominant landcover type [%]:

100.0


Radius: 2 km

Number of landcover classes:

1

Dominant landcover type:

200: bare areas

Fraction of dominant landcover type [%]:

100.0


Radius: 5 km

Number of landcover classes:

1

Dominant landcover type:

200: bare areas

Fraction of dominant landcover type [%]:

100.0


Radius: 10 km

Number of landcover classes:

2

Dominant landcover type:

200: bare areas

Fraction of dominant landcover type [%]:

96.0


Radius: 20 km

Number of landcover classes:

2

Dominant landcover type:

200: bare areas

Fraction of dominant landcover type [%]:

92.0


Disturbances


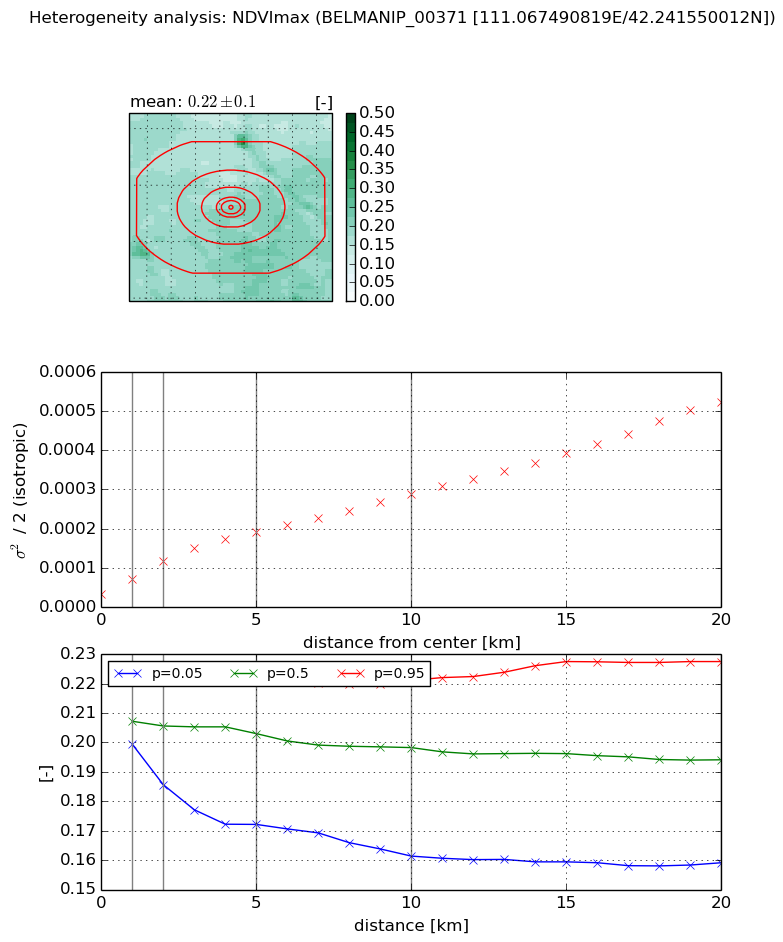
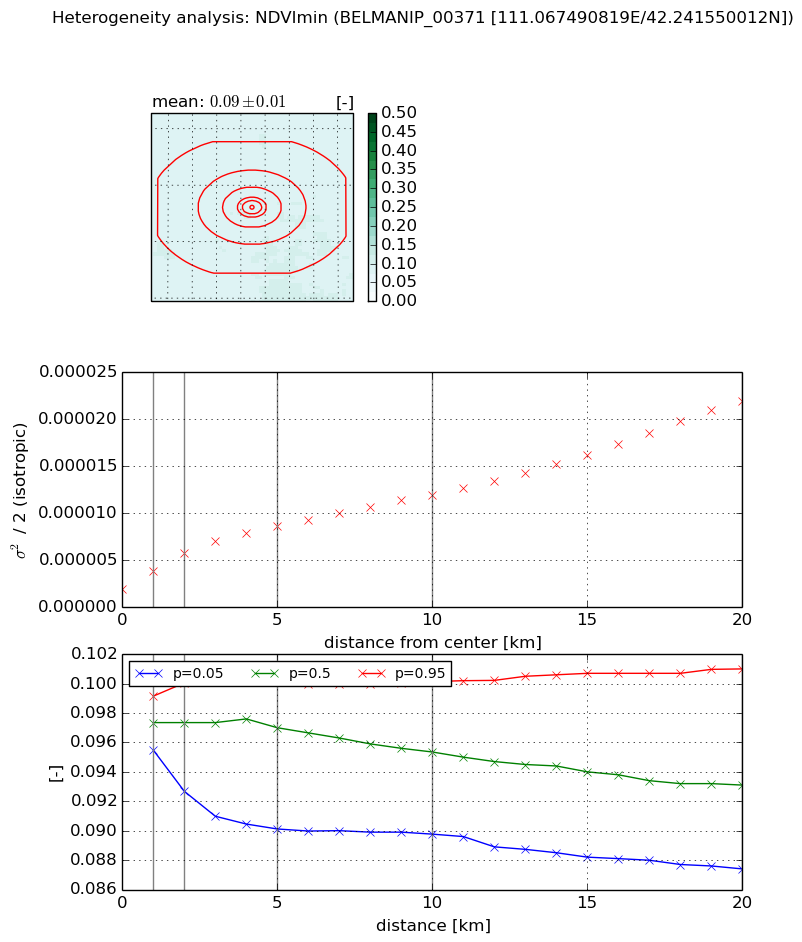
Heterogeneity analysis

The heterogeneity analysis provides information about the spatial and temporal heterogeneity of the site.

Topography


Roman et al. (2009) index


St

3.2374284827

Rcv

0.279591632044

Rse

0.0

Rst

-6.15274936829e-07

Rsv

-0.647069149537


Height range @ 1km [m]

34

Height range @ 2km [m]

55

Height range @ 5km [m]

76

Height range @ 10km [m]

-999

Height range @ 20km [m]

-999


Variance slope @ 1 km

80

Variance slope @ 2 km

110

Variance slope @ 5 km

119

Variance slope @ 10 km

-999

Variance slope @ 20 km

-999


NDVI (max. NDVI composite)


Roman et al. (2009) index


St

17.0492003031

Rcv

0.0746275753836

Rse

0.0

Rst

-0.0708240123299

Rsv

-0.0305097445874


NDVI range @ 1km [-]

0.02

NDVI range @ 2km [-]

0.04

NDVI range @ 5km [-]

0.05

NDVI range @ 10km [-]

0.06

NDVI range @ 20km [-]

0.07


Variance slope @ 1 km

3.79055693345e-05

Variance slope @ 2 km

4.20445809001e-05

Variance slope @ 5 km

3.22213101293e-05

Variance slope @ 10 km

2.38207911601e-05

Variance slope @ 20 km

2.24378997675e-05


NDVI (min. NDVI composite)I


Roman et al. (2009) index


St

2.21647933832e-07

Rcv

0.0147328443687

Rse

0.0

Rst

0.200755817025

Rsv

13534978.1988


NDVI range @ 1km [-]

0.0

NDVI range @ 2km [-]

0.01

NDVI range @ 5km [-]

0.01

NDVI range @ 10km [-]

0.01

NDVI range @ 20km [-]

0.01


NDVI slope @ 1 km

1.8590197789e-06

NDVI slope @ 2 km

1.92758459608e-06

NDVI slope @ 5 km

1.33662711728e-06

NDVI slope @ 10 km

9.29633653495e-07

NDVI slope @ 20 km

8.88686685598e-07


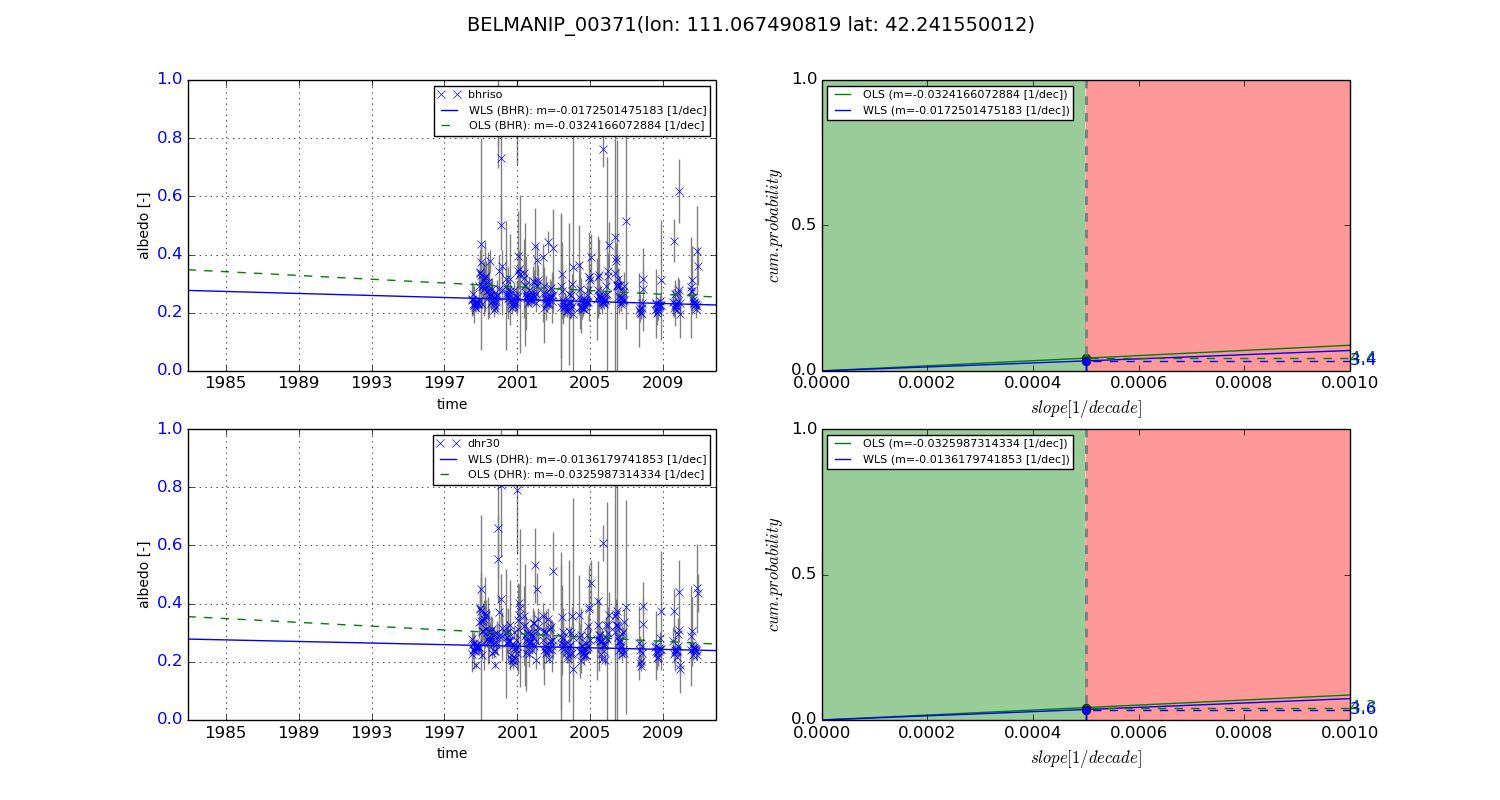
Temporal stability analysis

+000 deg (BHR)


BHR statistics

Temporal stability [1/decade]:


abs

rel


Weighted least square:

None


Ordinary least square:

None


Probabilities that GCOS criteria is met:

Weighted least square:

None %

Ordinary least square:

None %


DHR statistics

Temporal stability [1/decade]:


abs

rel


Weighted least square:

None


Ordinary least square:

None


Probabilities that GCOS criteria is met:

Weighted least square:

None %

Ordinary least square:

None %


+057/+063 deg (BHR)


BHR statistics

Temporal stability [1/decade]:


abs

rel


Weighted least square:

-0.0172501475183


Ordinary least square:

-0.0324166072884


Probabilities that GCOS criteria is met:

Weighted least square:

3.4 %

Ordinary least square:

4.4 %


DHR statistics

Temporal stability [1/decade]:


abs

rel


Weighted least square:

-0.0136179741853


Ordinary least square:

-0.0325987314334


Probabilities that GCOS criteria is met:

Weighted least square:

3.6 %

Ordinary least square:

4.3 %


Temporal anomaly analyis

The variance of the temporal anomalies provides an additional measure about the stability of the signal AFTER removal of the mean seasonal cylce.

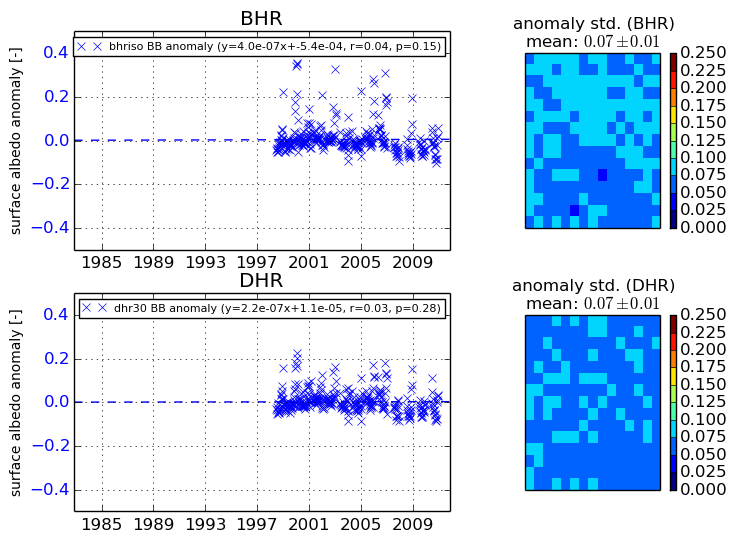
+000 deg


+057/+063 deg