BELMANIP_00372


Location

lon / lat [deg]: 107.26 / 40.9604

Source network: BELMANIP


Geostationary surface albedo (GSA) data


“+000”


“+057/+063”


Landcover information (based on ESA CCI landcover data)


Landcover fractions @ 2km distance


Landcover fractions @ 20 km distance


Legend


Distance to open water bodies [km]:

3.45

Distance to urban areas [km]:

9.05


Radius: 1 km

Number of landcover classes:

3

Dominant landcover type:

40: mosaic natural vegetation (tree, shrub, herbaceous cover) (>50%) / cropland (<50%)

Fraction of dominant landcover type [%]:

68.0


Radius: 2 km

Number of landcover classes:

4

Dominant landcover type:

40: mosaic natural vegetation (tree, shrub, herbaceous cover) (>50%) / cropland (<50%)

Fraction of dominant landcover type [%]:

74.0


Radius: 5 km

Number of landcover classes:

6

Dominant landcover type:

40: mosaic natural vegetation (tree, shrub, herbaceous cover) (>50%) / cropland (<50%)

Fraction of dominant landcover type [%]:

65.0


Radius: 10 km

Number of landcover classes:

5

Dominant landcover type:

40: mosaic natural vegetation (tree, shrub, herbaceous cover) (>50%) / cropland (<50%)

Fraction of dominant landcover type [%]:

62.0


Radius: 20 km

Number of landcover classes:

6

Dominant landcover type:

40: mosaic natural vegetation (tree, shrub, herbaceous cover) (>50%) / cropland (<50%)

Fraction of dominant landcover type [%]:

48.0


Disturbances


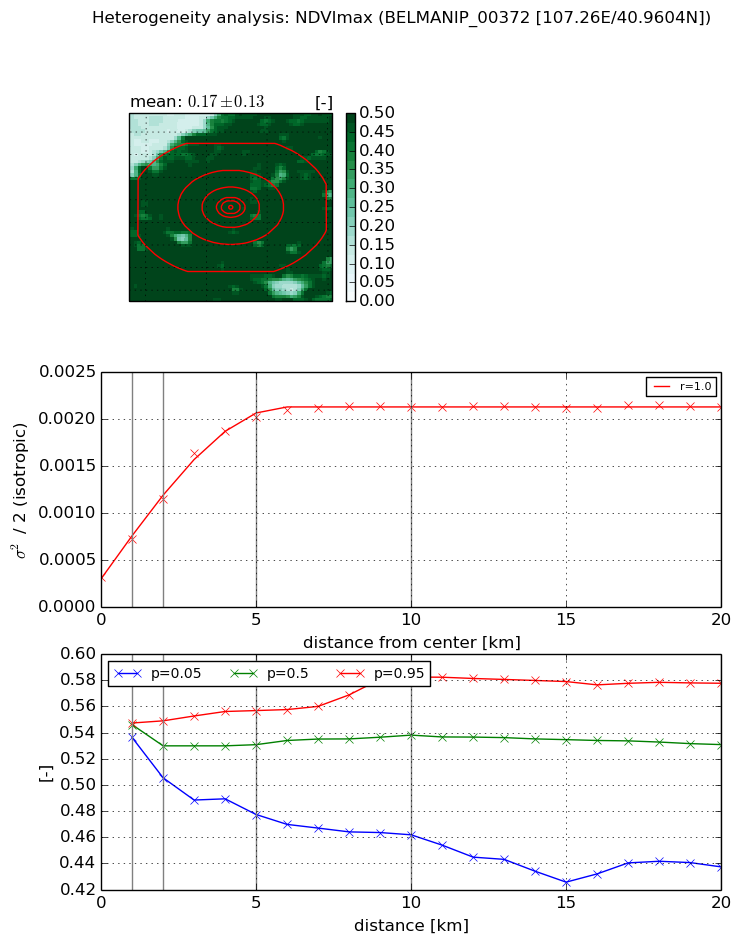
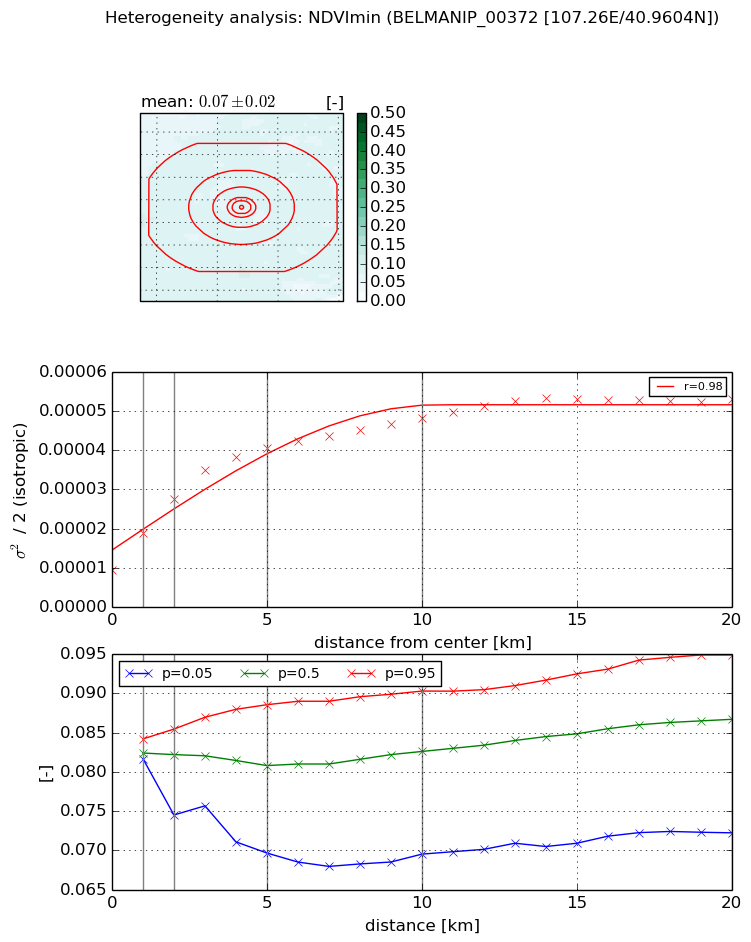
Heterogeneity analysis

The heterogeneity analysis provides information about the spatial and temporal heterogeneity of the site.

Topography


Roman et al. (2009) index


St

2.00709093318

Rcv

0.0900976637441

Rse

0.0

Rst

-0.404610252321

Rsv

-0.999992672936


Height range @ 1km [m]

3

Height range @ 2km [m]

4

Height range @ 5km [m]

4

Height range @ 10km [m]

-999

Height range @ 20km [m]

-999


Variance slope @ 1 km

0

Variance slope @ 2 km

0

Variance slope @ 5 km

0

Variance slope @ 10 km

-999

Variance slope @ 20 km

-999


NDVI (max. NDVI composite)


Roman et al. (2009) index


St

2.04766682703

Rcv

0.296108686842

Rse

0.0

Rst

-0.168973522249

Rsv

-0.99999988356


NDVI range @ 1km [-]

0.01

NDVI range @ 2km [-]

0.04

NDVI range @ 5km [-]

0.08

NDVI range @ 10km [-]

0.12

NDVI range @ 20km [-]

0.14


Variance slope @ 1 km

0.000399863036924

Variance slope @ 2 km

0.000414247696205

Variance slope @ 5 km

0.000354232703276

Variance slope @ 10 km

0.000170330784267

Variance slope @ 20 km

5.77872937096e-05


NDVI (min. NDVI composite)I


Roman et al. (2009) index


St

0.43869168587

Rcv

0.816790952029

Rse

0.0

Rst

-0.647729653001

Rsv

5.37399513763


NDVI range @ 1km [-]

0.0

NDVI range @ 2km [-]

0.01

NDVI range @ 5km [-]

0.02

NDVI range @ 10km [-]

0.02

NDVI range @ 20km [-]

0.02


NDVI slope @ 1 km

9.59663649492e-06

NDVI slope @ 2 km

9.05642475013e-06

NDVI slope @ 5 km

6.3525646506e-06

NDVI slope @ 10 km

3.44991346069e-06

NDVI slope @ 20 km

1.68353683917e-06


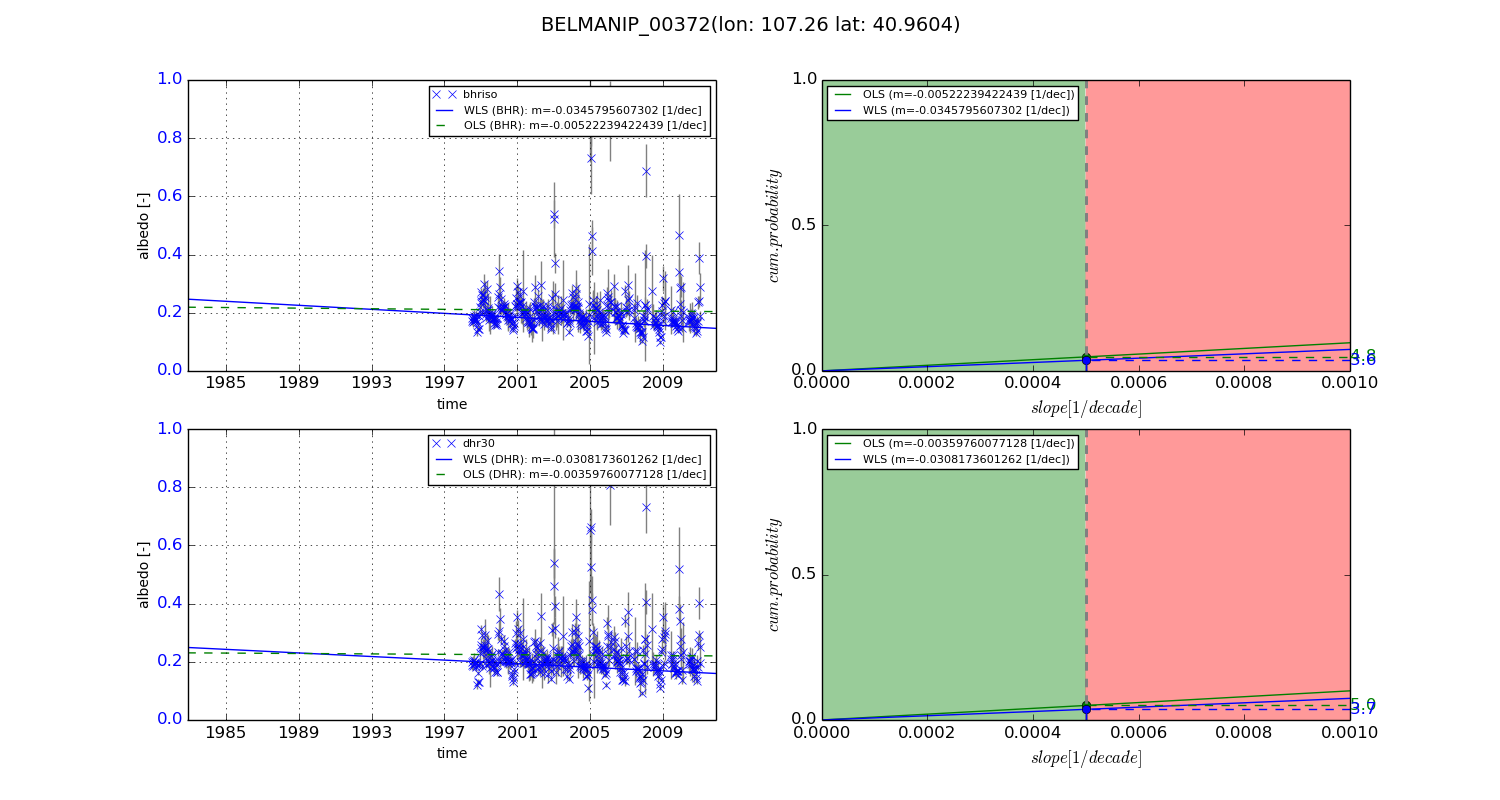
Temporal stability analysis

+000 deg (BHR)


BHR statistics

Temporal stability [1/decade]:


abs

rel


Weighted least square:

None


Ordinary least square:

None


Probabilities that GCOS criteria is met:

Weighted least square:

None %

Ordinary least square:

None %


DHR statistics

Temporal stability [1/decade]:


abs

rel


Weighted least square:

None


Ordinary least square:

None


Probabilities that GCOS criteria is met:

Weighted least square:

None %

Ordinary least square:

None %


+057/+063 deg (BHR)


BHR statistics

Temporal stability [1/decade]:


abs

rel


Weighted least square:

-0.0345795607302


Ordinary least square:

-0.00522239422439


Probabilities that GCOS criteria is met:

Weighted least square:

3.6 %

Ordinary least square:

4.8 %


DHR statistics

Temporal stability [1/decade]:


abs

rel


Weighted least square:

-0.0308173601262


Ordinary least square:

-0.00359760077128


Probabilities that GCOS criteria is met:

Weighted least square:

3.7 %

Ordinary least square:

5.0 %


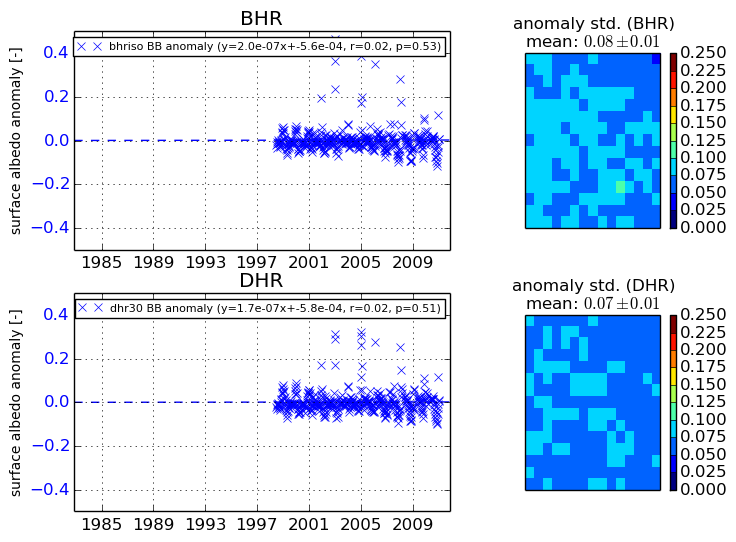
Temporal anomaly analyis

The variance of the temporal anomalies provides an additional measure about the stability of the signal AFTER removal of the mean seasonal cylce.

+000 deg


+057/+063 deg


By continuing to use this website, you are giving consent to analytic cookies being used. For more information on how EUMETSAT uses data and how you can disable this, please view this web page: Analytics Cookie Policy