BELMANIP_00376


Location

lon / lat [deg]: 62.172 / 44.3875

Source network: BELMANIP


Geostationary surface albedo (GSA) data


“+000”


“+057/+063”


Landcover information (based on ESA CCI landcover data)


Landcover fractions @ 2km distance


Landcover fractions @ 20 km distance


Legend


Distance to open water bodies [km]:

24.6

Distance to urban areas [km]:

none in region


Radius: 1 km

Number of landcover classes:

1

Dominant landcover type:

200: bare areas

Fraction of dominant landcover type [%]:

100.0


Radius: 2 km

Number of landcover classes:

1

Dominant landcover type:

200: bare areas

Fraction of dominant landcover type [%]:

100.0


Radius: 5 km

Number of landcover classes:

1

Dominant landcover type:

200: bare areas

Fraction of dominant landcover type [%]:

100.0


Radius: 10 km

Number of landcover classes:

1

Dominant landcover type:

200: bare areas

Fraction of dominant landcover type [%]:

100.0


Radius: 20 km

Number of landcover classes:

1

Dominant landcover type:

200: bare areas

Fraction of dominant landcover type [%]:

100.0


Disturbances


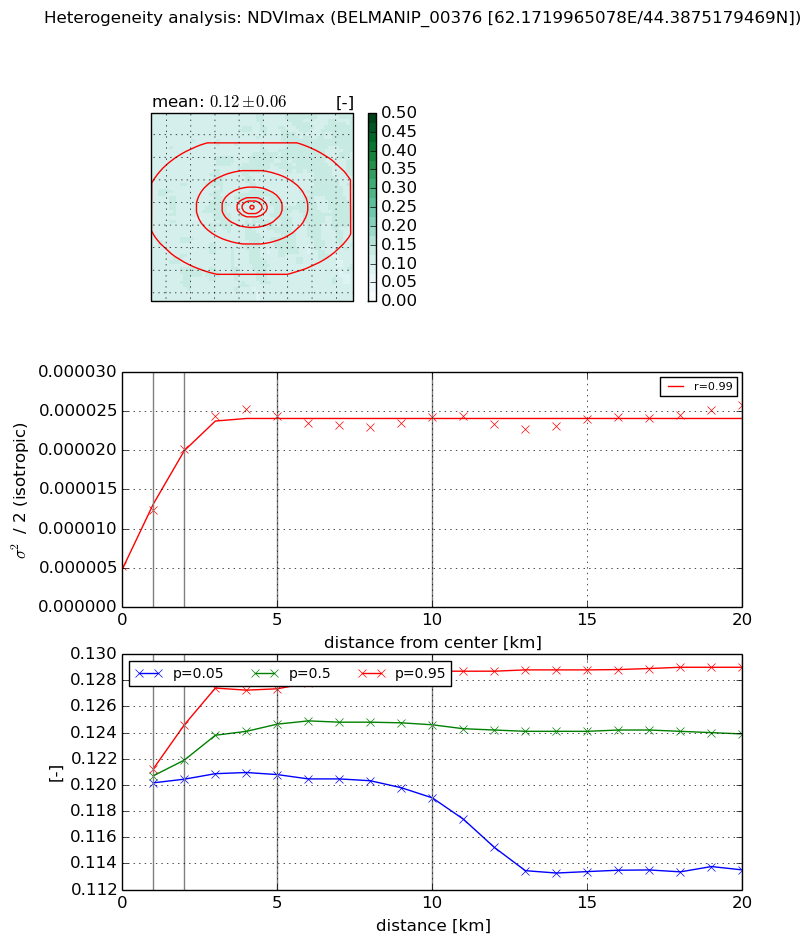
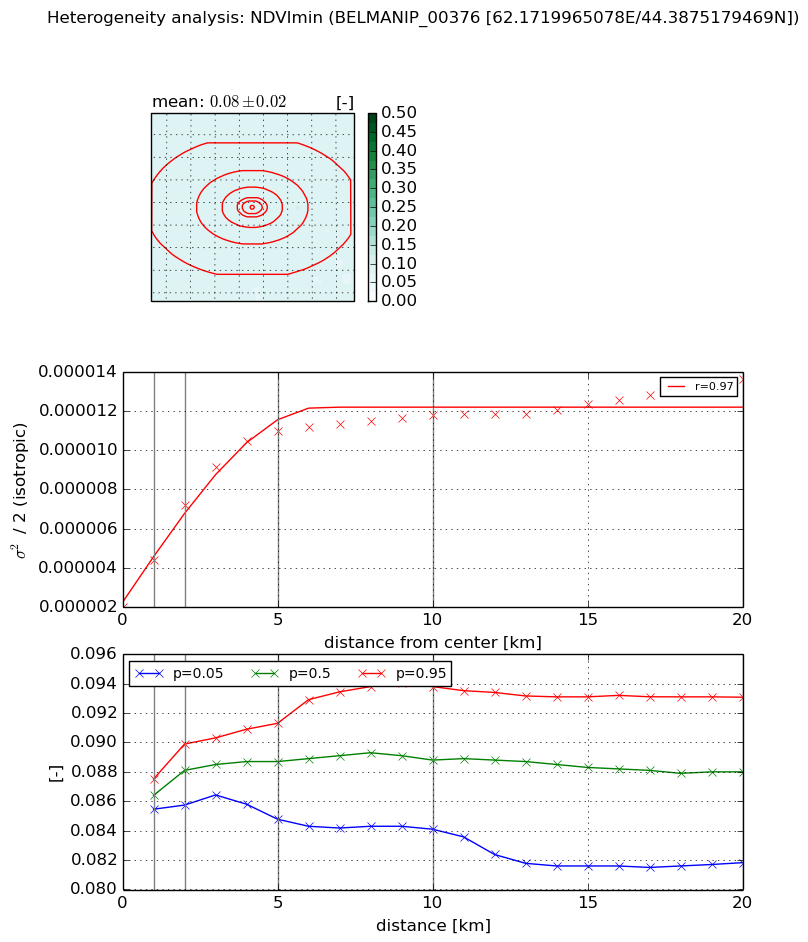
Heterogeneity analysis

The heterogeneity analysis provides information about the spatial and temporal heterogeneity of the site.

Topography


Roman et al. (2009) index


St

0.000134809699989

Rcv

0.1568445732

Rse

0.0

Rst

-0.216576445873

Rsv

22253.2181251


Height range @ 1km [m]

6

Height range @ 2km [m]

6

Height range @ 5km [m]

10

Height range @ 10km [m]

-999

Height range @ 20km [m]

-999


Variance slope @ 1 km

4

Variance slope @ 2 km

2

Variance slope @ 5 km

1

Variance slope @ 10 km

-999

Variance slope @ 20 km

-999


NDVI (max. NDVI composite)


Roman et al. (2009) index


St

4.39261345775

Rcv

0.0418817908191

Rse

0.0

Rst

-0.0641447861429

Rsv

0.57693813843


NDVI range @ 1km [-]

0.0

NDVI range @ 2km [-]

0.0

NDVI range @ 5km [-]

0.01

NDVI range @ 10km [-]

0.01

NDVI range @ 20km [-]

0.02


Variance slope @ 1 km

7.17987760592e-06

Variance slope @ 2 km

7.49003460753e-06

Variance slope @ 5 km

3.96717762168e-06

Variance slope @ 10 km

1.30630321513e-06

Variance slope @ 20 km

4.45806463044e-07


NDVI (min. NDVI composite)I


Roman et al. (2009) index


St

1.39839987786

Rcv

0.617041961189

Rse

0.0

Rst

-0.528267500229

Rsv

-0.999999650438


NDVI range @ 1km [-]

0.0

NDVI range @ 2km [-]

0.0

NDVI range @ 5km [-]

0.01

NDVI range @ 10km [-]

0.01

NDVI range @ 20km [-]

0.01


NDVI slope @ 1 km

2.39570541309e-06

NDVI slope @ 2 km

2.58322604133e-06

NDVI slope @ 5 km

1.85595303257e-06

NDVI slope @ 10 km

8.70229772526e-07

NDVI slope @ 20 km

3.83140335446e-07


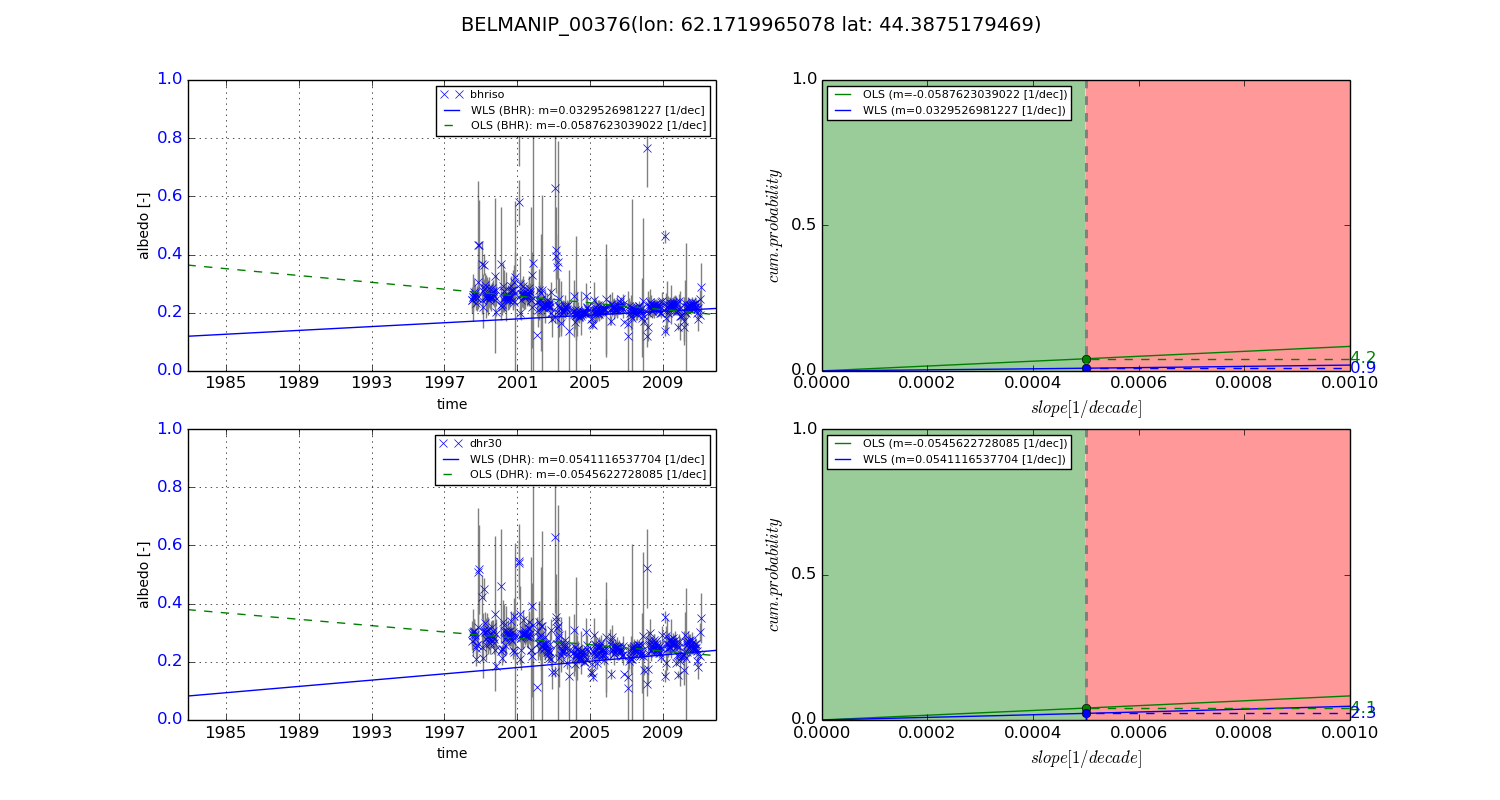
Temporal stability analysis

+000 deg (BHR)


BHR statistics

Temporal stability [1/decade]:


abs

rel


Weighted least square:

-99999.0


Ordinary least square:

-99999.0


Probabilities that GCOS criteria is met:

Weighted least square:

-99999.0 %

Ordinary least square:

-99999.0 %


DHR statistics

Temporal stability [1/decade]:


abs

rel


Weighted least square:

-99999.0


Ordinary least square:

-99999.0


Probabilities that GCOS criteria is met:

Weighted least square:

-99999.0 %

Ordinary least square:

-99999.0 %


+057/+063 deg (BHR)


BHR statistics

Temporal stability [1/decade]:


abs

rel


Weighted least square:

0.0329526981227


Ordinary least square:

-0.0587623039022


Probabilities that GCOS criteria is met:

Weighted least square:

0.9 %

Ordinary least square:

4.2 %


DHR statistics

Temporal stability [1/decade]:


abs

rel


Weighted least square:

0.0541116537704


Ordinary least square:

-0.0545622728085


Probabilities that GCOS criteria is met:

Weighted least square:

2.3 %

Ordinary least square:

4.1 %


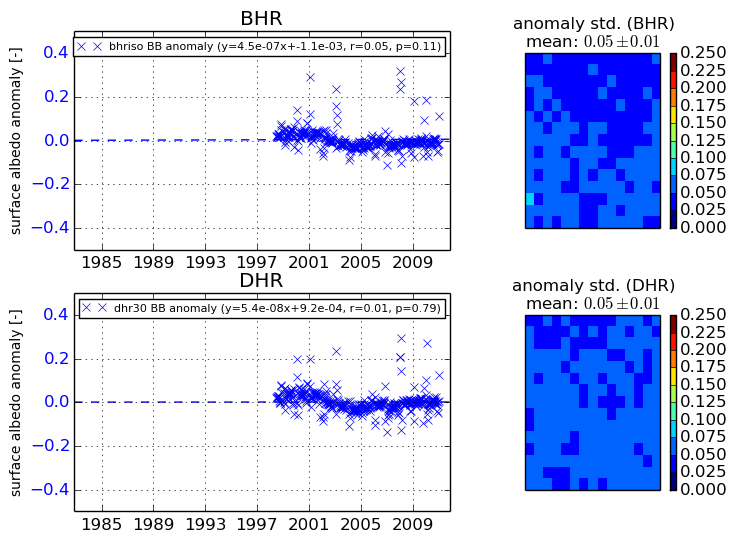
Temporal anomaly analyis

The variance of the temporal anomalies provides an additional measure about the stability of the signal AFTER removal of the mean seasonal cylce.
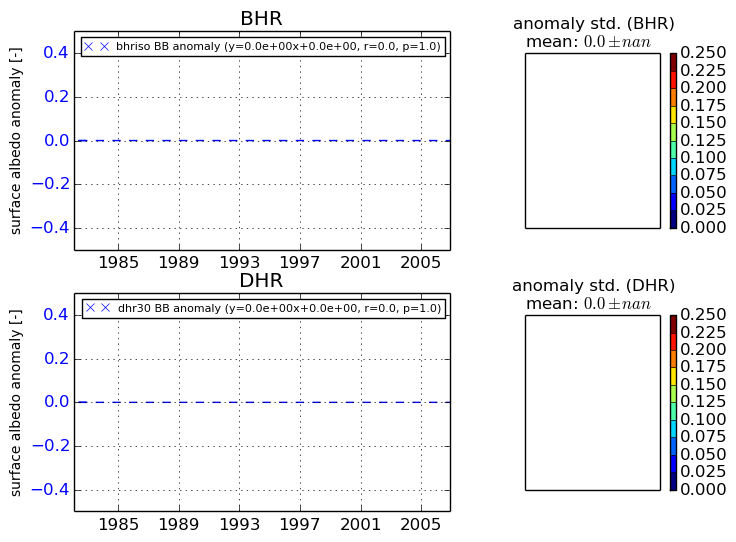
+000 deg


+057/+063 deg