BELMANIP_00377


Location

lon / lat [deg]: 68.725 / 45.7623

Source network: BELMANIP


Geostationary surface albedo (GSA) data


“+000”


“+057/+063”


Landcover information (based on ESA CCI landcover data)


Landcover fractions @ 2km distance


Landcover fractions @ 20 km distance


Legend


Distance to open water bodies [km]:

36.78

Distance to urban areas [km]:

none in region


Radius: 1 km

Number of landcover classes:

1

Dominant landcover type:

200: bare areas

Fraction of dominant landcover type [%]:

100.0


Radius: 2 km

Number of landcover classes:

1

Dominant landcover type:

200: bare areas

Fraction of dominant landcover type [%]:

100.0


Radius: 5 km

Number of landcover classes:

1

Dominant landcover type:

200: bare areas

Fraction of dominant landcover type [%]:

100.0


Radius: 10 km

Number of landcover classes:

1

Dominant landcover type:

200: bare areas

Fraction of dominant landcover type [%]:

100.0


Radius: 20 km

Number of landcover classes:

1

Dominant landcover type:

200: bare areas

Fraction of dominant landcover type [%]:

100.0


Disturbances


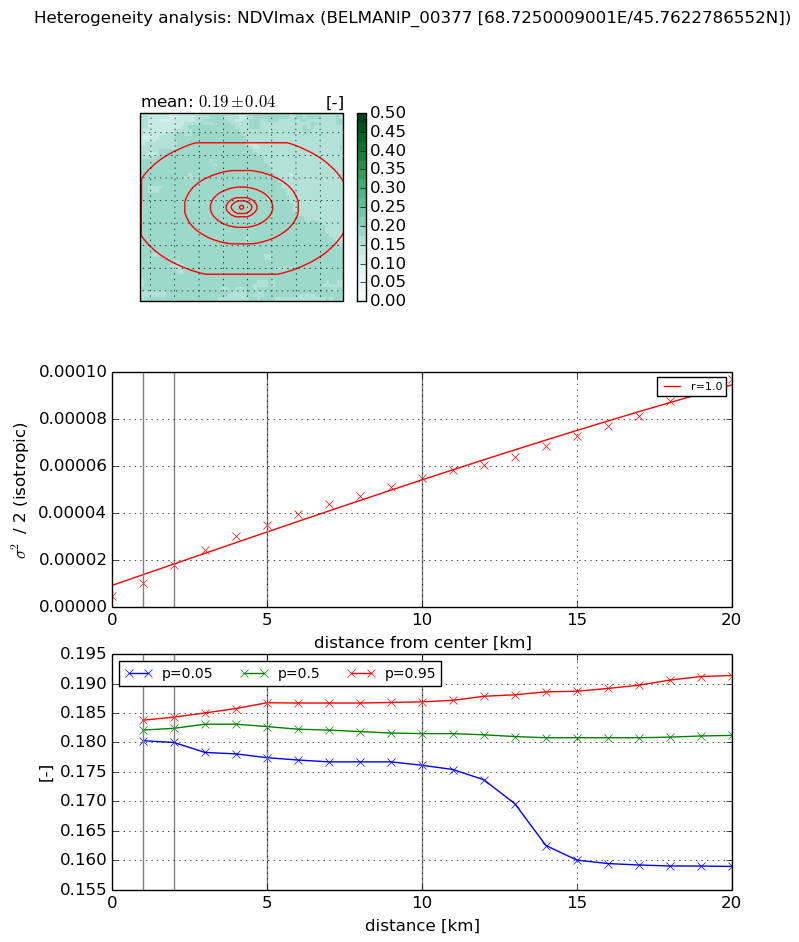
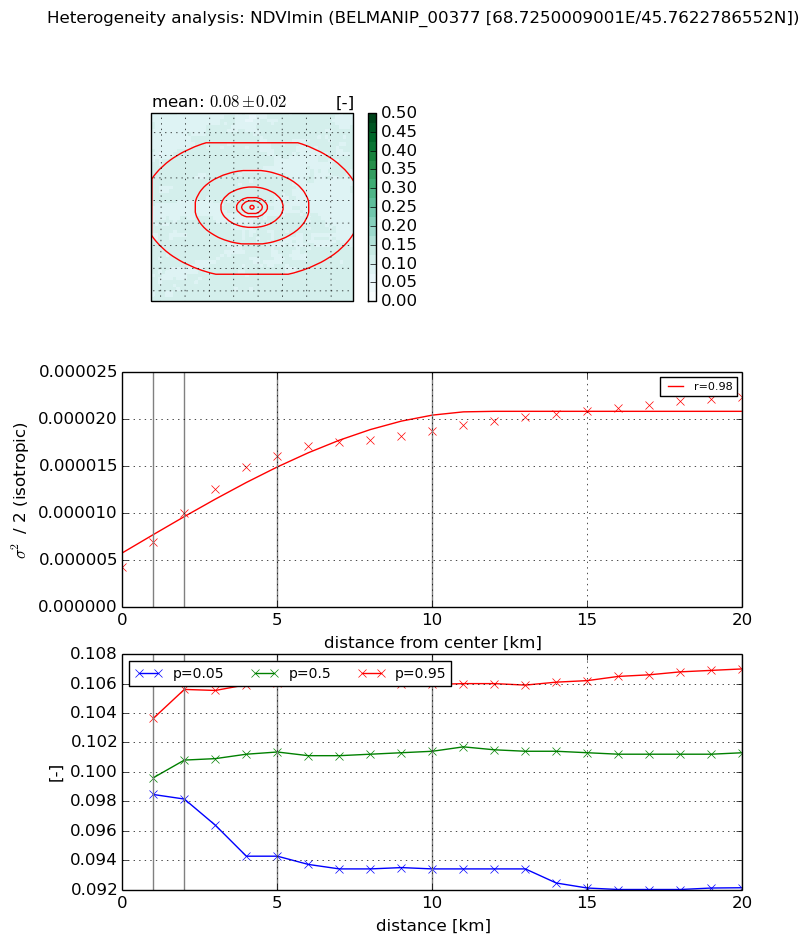
Heterogeneity analysis

The heterogeneity analysis provides information about the spatial and temporal heterogeneity of the site.

Topography


Roman et al. (2009) index


St

2.28250685405

Rcv

0.238134683003

Rse

0.0

Rst

-0.0762099866084

Rsv

-0.999999685884


Height range @ 1km [m]

2

Height range @ 2km [m]

3

Height range @ 5km [m]

5

Height range @ 10km [m]

-999

Height range @ 20km [m]

-999


Variance slope @ 1 km

0

Variance slope @ 2 km

0

Variance slope @ 5 km

0

Variance slope @ 10 km

-999

Variance slope @ 20 km

-999


NDVI (max. NDVI composite)


Roman et al. (2009) index


St

1.53802108426

Rcv

0.384144741642

Rse

0.0

Rst

-0.245818420664

Rsv

1.32059527328


NDVI range @ 1km [-]

0.0

NDVI range @ 2km [-]

0.0

NDVI range @ 5km [-]

0.01

NDVI range @ 10km [-]

0.01

NDVI range @ 20km [-]

0.03


Variance slope @ 1 km

5.35587008687e-06

Variance slope @ 2 km

6.63277249662e-06

Variance slope @ 5 km

6.18511523823e-06

Variance slope @ 10 km

5.0137682041e-06

Variance slope @ 20 km

4.28703011602e-06


NDVI (min. NDVI composite)I


Roman et al. (2009) index


St

5.21133706784

Rcv

0.17584428915

Rse

0.0

Rst

-0.198058714066

Rsv

0.201764999246


NDVI range @ 1km [-]

0.01

NDVI range @ 2km [-]

0.01

NDVI range @ 5km [-]

0.01

NDVI range @ 10km [-]

0.01

NDVI range @ 20km [-]

0.01


NDVI slope @ 1 km

2.66629143206e-06

NDVI slope @ 2 km

2.87135582308e-06

NDVI slope @ 5 km

2.43509942477e-06

NDVI slope @ 10 km

1.38803401408e-06

NDVI slope @ 20 km

7.3044302771e-07


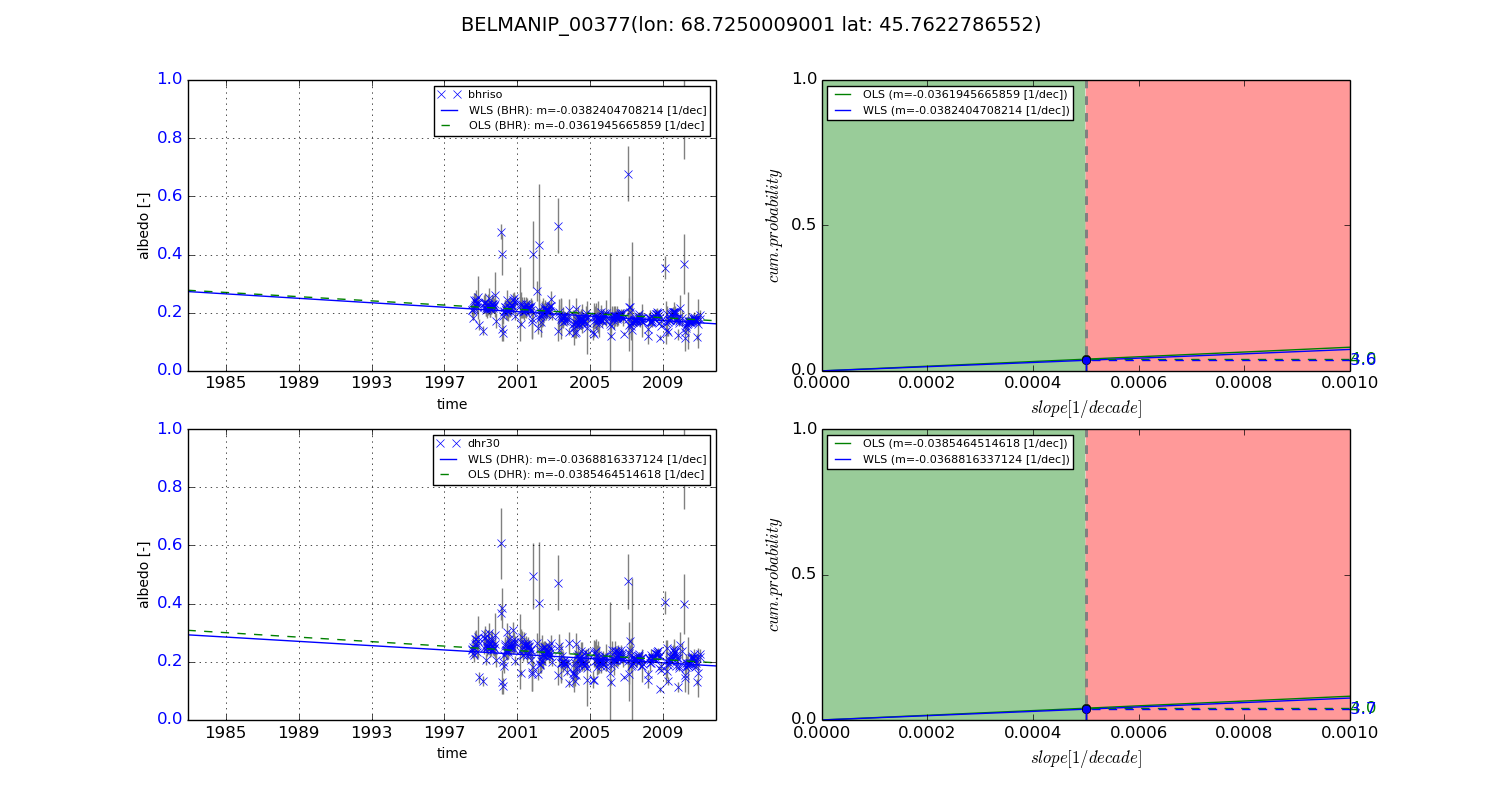
Temporal stability analysis

+000 deg (BHR)


BHR statistics

Temporal stability [1/decade]:


abs

rel


Weighted least square:

-99999.0


Ordinary least square:

-99999.0


Probabilities that GCOS criteria is met:

Weighted least square:

-99999.0 %

Ordinary least square:

-99999.0 %


DHR statistics

Temporal stability [1/decade]:


abs

rel


Weighted least square:

-99999.0


Ordinary least square:

-99999.0


Probabilities that GCOS criteria is met:

Weighted least square:

-99999.0 %

Ordinary least square:

-99999.0 %


+057/+063 deg (BHR)


BHR statistics

Temporal stability [1/decade]:


abs

rel


Weighted least square:

-0.0382404708214


Ordinary least square:

-0.0361945665859


Probabilities that GCOS criteria is met:

Weighted least square:

3.6 %

Ordinary least square:

4.0 %


DHR statistics

Temporal stability [1/decade]:


abs

rel


Weighted least square:

-0.0368816337124


Ordinary least square:

-0.0385464514618


Probabilities that GCOS criteria is met:

Weighted least square:

3.7 %

Ordinary least square:

4.0 %


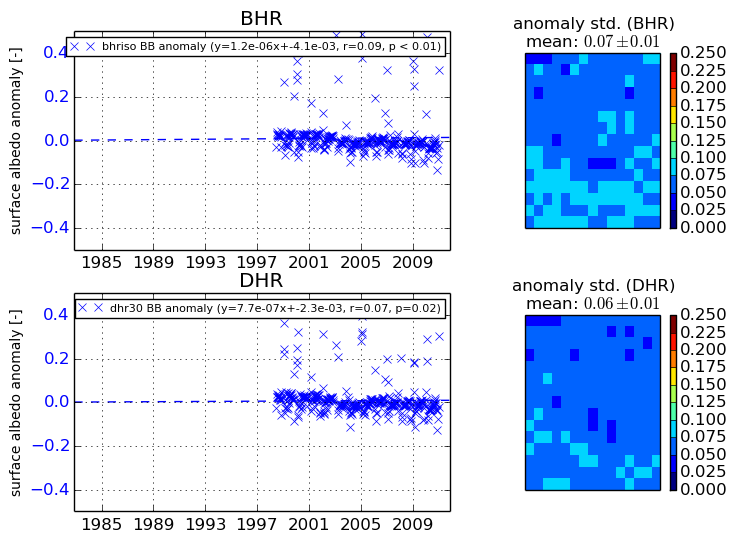
Temporal anomaly analyis

The variance of the temporal anomalies provides an additional measure about the stability of the signal AFTER removal of the mean seasonal cylce.
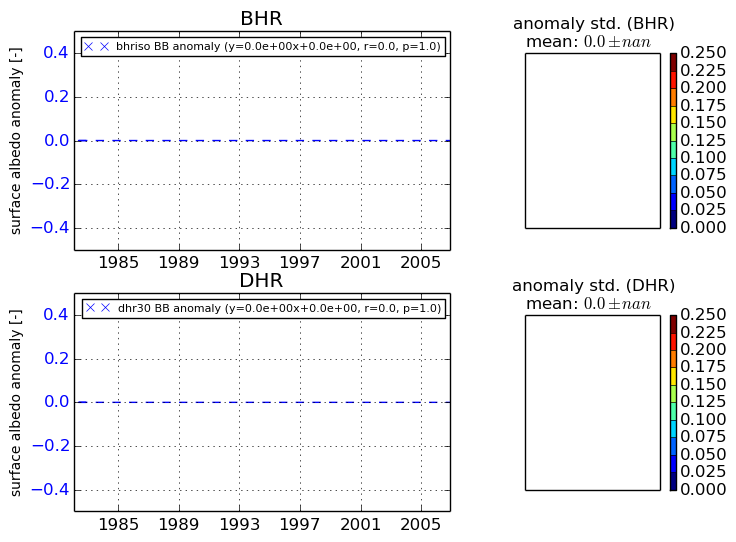
+000 deg


+057/+063 deg