BELMANIP_00379


Location

lon / lat [deg]: 88.0816 / 45.2426

Source network: BELMANIP


Geostationary surface albedo (GSA) data


“+000”


“+057/+063”


Landcover information (based on ESA CCI landcover data)


Landcover fractions @ 2km distance


Landcover fractions @ 20 km distance


Legend


Distance to open water bodies [km]:

none in region

Distance to urban areas [km]:

32.96


Radius: 1 km

Number of landcover classes:

1

Dominant landcover type:

200: bare areas

Fraction of dominant landcover type [%]:

100.0


Radius: 2 km

Number of landcover classes:

1

Dominant landcover type:

200: bare areas

Fraction of dominant landcover type [%]:

100.0


Radius: 5 km

Number of landcover classes:

1

Dominant landcover type:

200: bare areas

Fraction of dominant landcover type [%]:

100.0


Radius: 10 km

Number of landcover classes:

1

Dominant landcover type:

200: bare areas

Fraction of dominant landcover type [%]:

100.0


Radius: 20 km

Number of landcover classes:

1

Dominant landcover type:

200: bare areas

Fraction of dominant landcover type [%]:

100.0


Disturbances


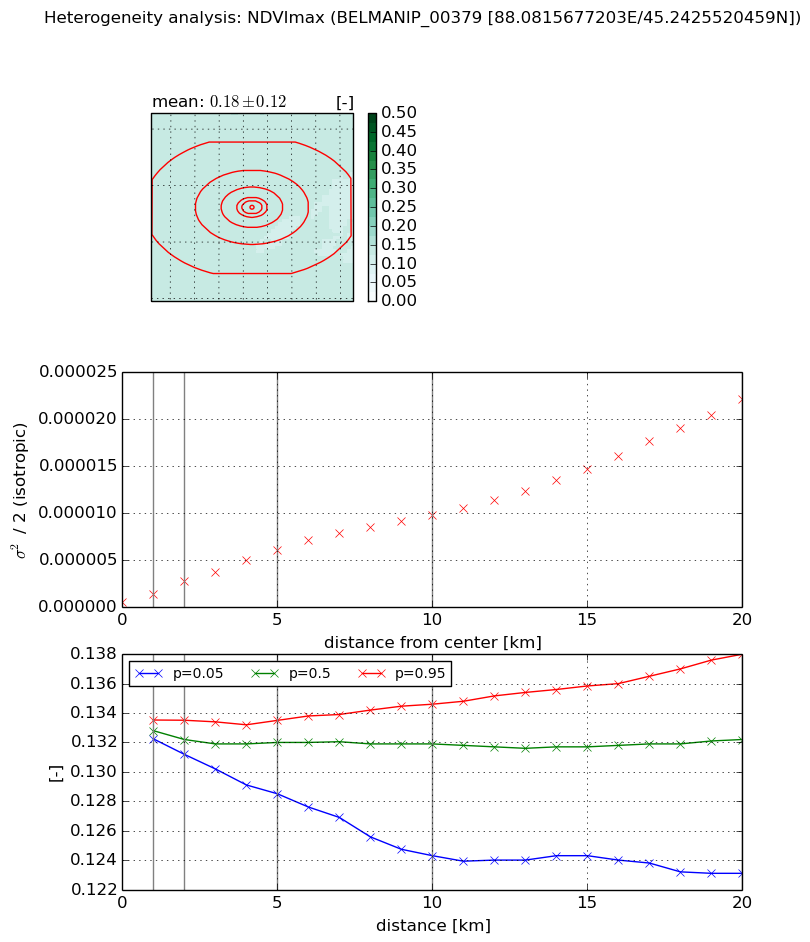
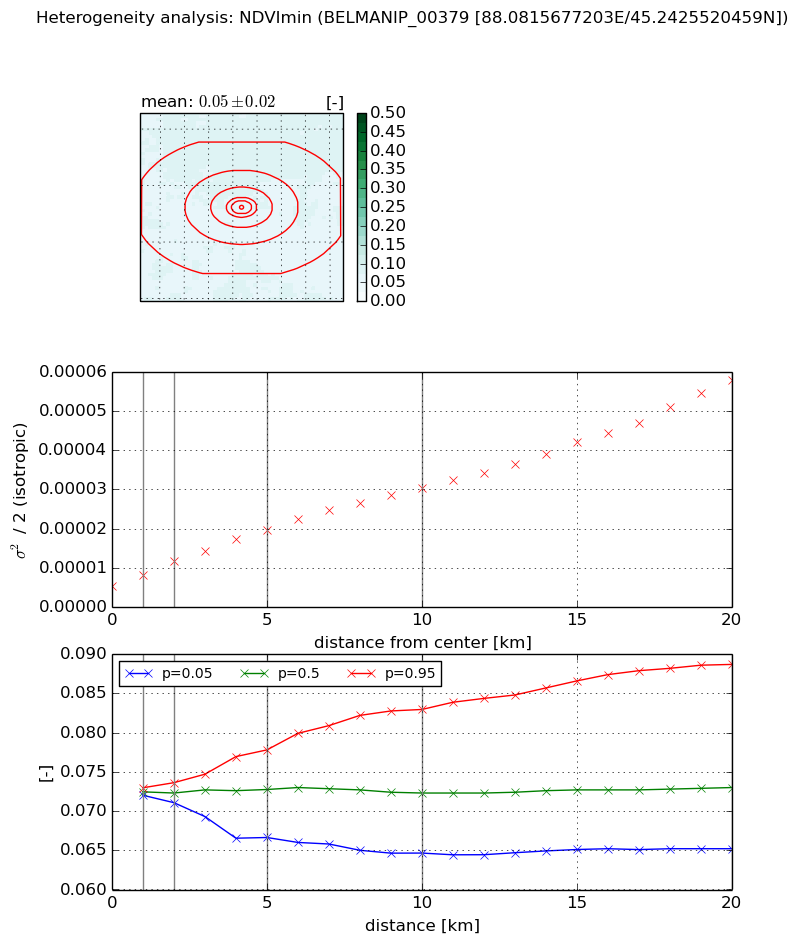
Heterogeneity analysis

The heterogeneity analysis provides information about the spatial and temporal heterogeneity of the site.

Topography


Roman et al. (2009) index


St

2.14201339882

Rcv

0.400551743581

Rse

0.0

Rst

-3.43222360465e-09

Rsv

-0.999999716231


Height range @ 1km [m]

16

Height range @ 2km [m]

20

Height range @ 5km [m]

32

Height range @ 10km [m]

-999

Height range @ 20km [m]

-999


Variance slope @ 1 km

17

Variance slope @ 2 km

11

Variance slope @ 5 km

16

Variance slope @ 10 km

-999

Variance slope @ 20 km

-999


NDVI (max. NDVI composite)


Roman et al. (2009) index


St

1.32257372367

Rcv

0.576229803202

Rse

0.0

Rst

-0.28147971592

Rsv

1.41059503458


NDVI range @ 1km [-]

0.0

NDVI range @ 2km [-]

0.0

NDVI range @ 5km [-]

0.0

NDVI range @ 10km [-]

0.01

NDVI range @ 20km [-]

0.01


Variance slope @ 1 km

8.07822655626e-07

Variance slope @ 2 km

1.10718279614e-06

Variance slope @ 5 km

1.12913273191e-06

Variance slope @ 10 km

9.51042329033e-07

Variance slope @ 20 km

9.976914991e-07


NDVI (min. NDVI composite)I


Roman et al. (2009) index


St

2.61039636244e-08

Rcv

0.806412357687

Rse

0.0

Rst

0.120559631057

Rsv

114925074.942


NDVI range @ 1km [-]

0.0

NDVI range @ 2km [-]

0.0

NDVI range @ 5km [-]

0.01

NDVI range @ 10km [-]

0.02

NDVI range @ 20km [-]

0.02


NDVI slope @ 1 km

2.8952468894e-06

NDVI slope @ 2 km

3.18275471391e-06

NDVI slope @ 5 km

2.90056789473e-06

NDVI slope @ 10 km

2.50919177756e-06

NDVI slope @ 20 km

2.44225729072e-06


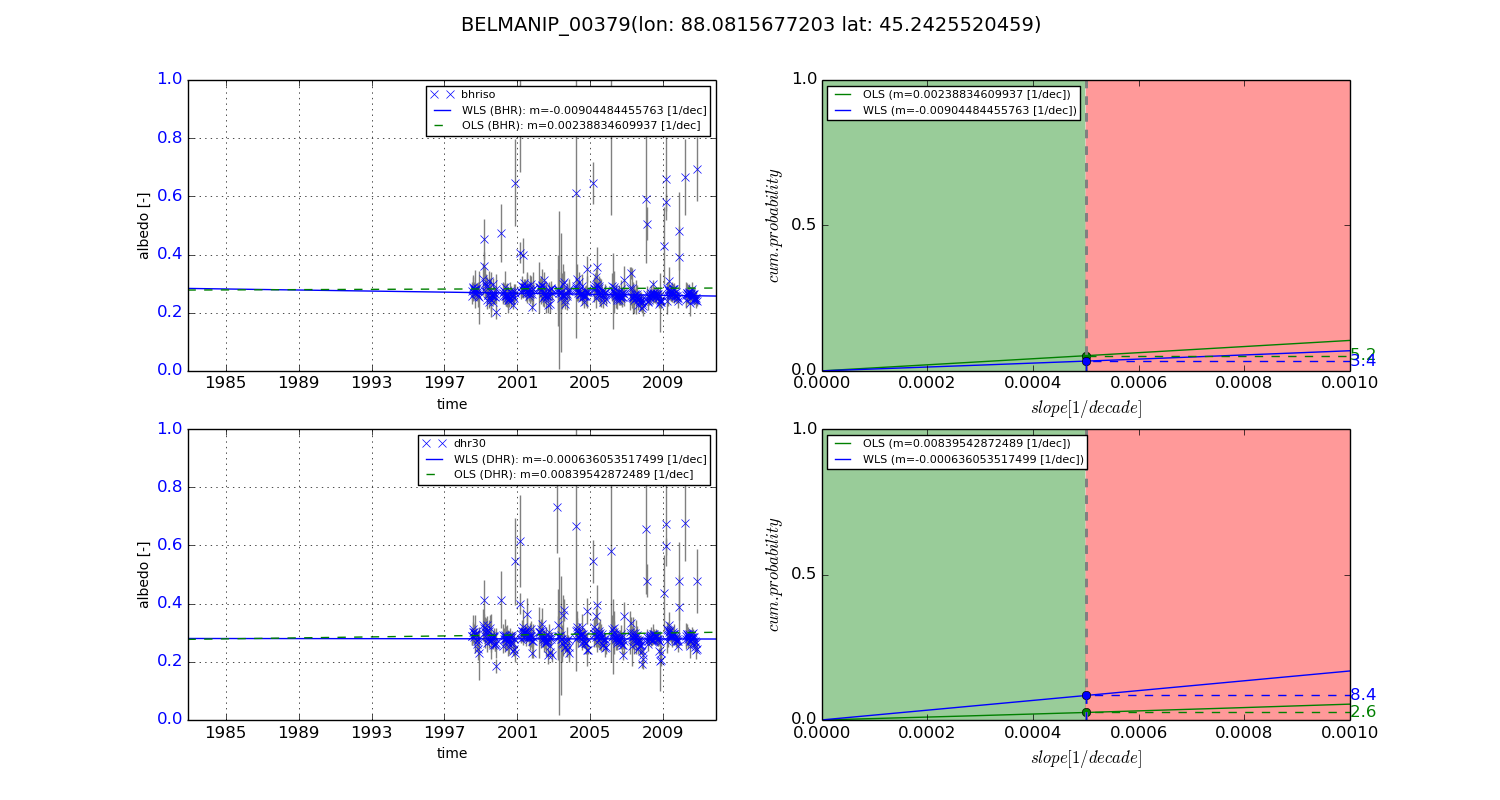
Temporal stability analysis

+000 deg (BHR)


BHR statistics

Temporal stability [1/decade]:


abs

rel


Weighted least square:

None


Ordinary least square:

None


Probabilities that GCOS criteria is met:

Weighted least square:

None %

Ordinary least square:

None %


DHR statistics

Temporal stability [1/decade]:


abs

rel


Weighted least square:

None


Ordinary least square:

None


Probabilities that GCOS criteria is met:

Weighted least square:

None %

Ordinary least square:

None %


+057/+063 deg (BHR)


BHR statistics

Temporal stability [1/decade]:


abs

rel


Weighted least square:

-0.00904484455763


Ordinary least square:

0.00238834609937


Probabilities that GCOS criteria is met:

Weighted least square:

3.4 %

Ordinary least square:

5.2 %


DHR statistics

Temporal stability [1/decade]:


abs

rel


Weighted least square:

-0.000636053517499


Ordinary least square:

0.00839542872489


Probabilities that GCOS criteria is met:

Weighted least square:

8.4 %

Ordinary least square:

2.6 %


Temporal anomaly analyis

The variance of the temporal anomalies provides an additional measure about the stability of the signal AFTER removal of the mean seasonal cylce.

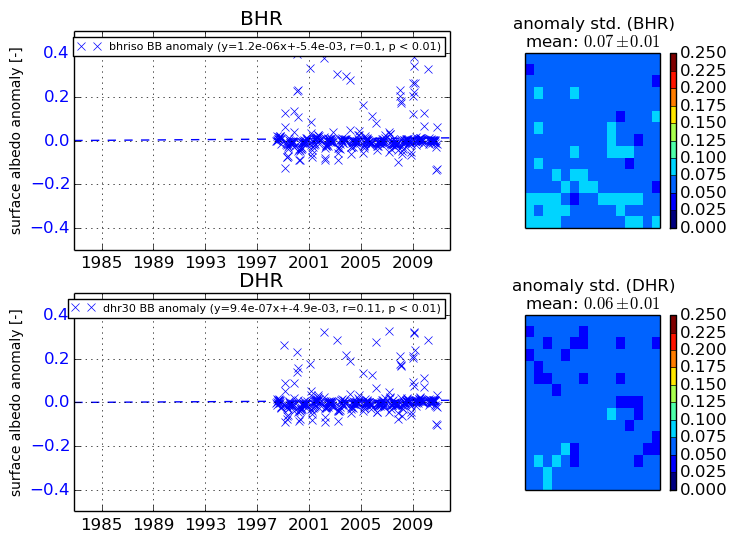
+000 deg


+057/+063 deg