BELMANIP_00388


Location

lon / lat [deg]: 106.045 / 56.0803

Source network: BELMANIP


Geostationary surface albedo (GSA) data


“+000”


“+057/+063”


Landcover information (based on ESA CCI landcover data)


Landcover fractions @ 2km distance


Landcover fractions @ 20 km distance


Legend


Distance to open water bodies [km]:

11.64

Distance to urban areas [km]:

none in region


Radius: 1 km

Number of landcover classes:

4

Dominant landcover type:

90: Tree cover, mixed leaf type

Fraction of dominant landcover type [%]:

81.0


Radius: 2 km

Number of landcover classes:

4

Dominant landcover type:

90: Tree cover, mixed leaf type

Fraction of dominant landcover type [%]:

62.0


Radius: 5 km

Number of landcover classes:

4

Dominant landcover type:

70: Tree cover, needleleaved, evergreen, closed to open (>15%)

Fraction of dominant landcover type [%]:

66.0


Radius: 10 km

Number of landcover classes:

2

Dominant landcover type:

70: Tree cover, needleleaved, evergreen, closed to open (>15%)

Fraction of dominant landcover type [%]:

83.0


Radius: 20 km

Number of landcover classes:

3

Dominant landcover type:

70: Tree cover, needleleaved, evergreen, closed to open (>15%)

Fraction of dominant landcover type [%]:

84.0


Disturbances


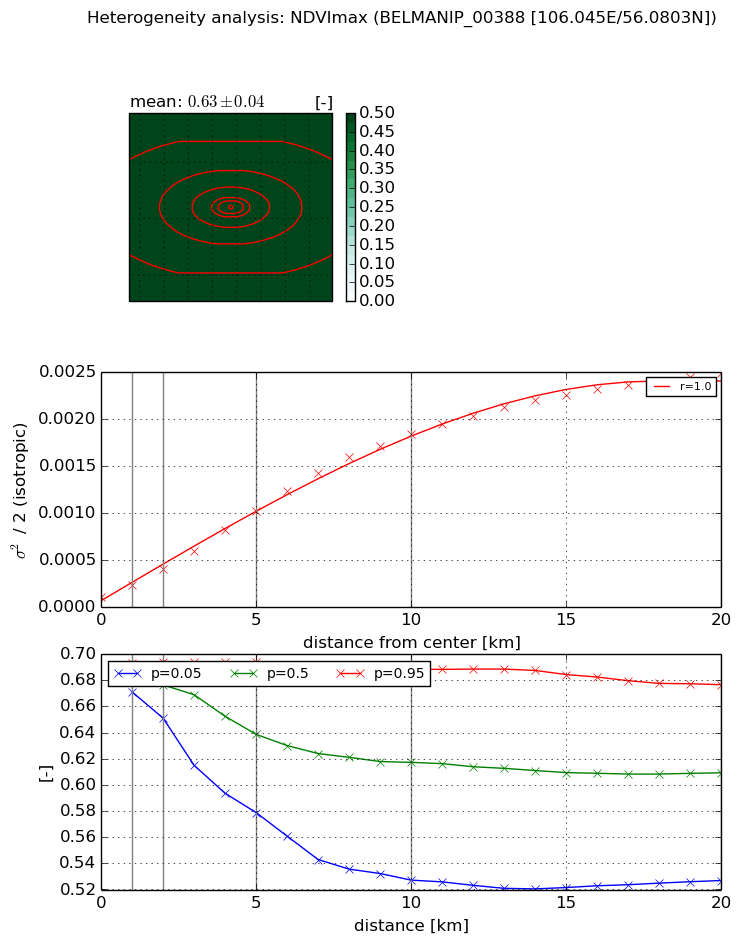
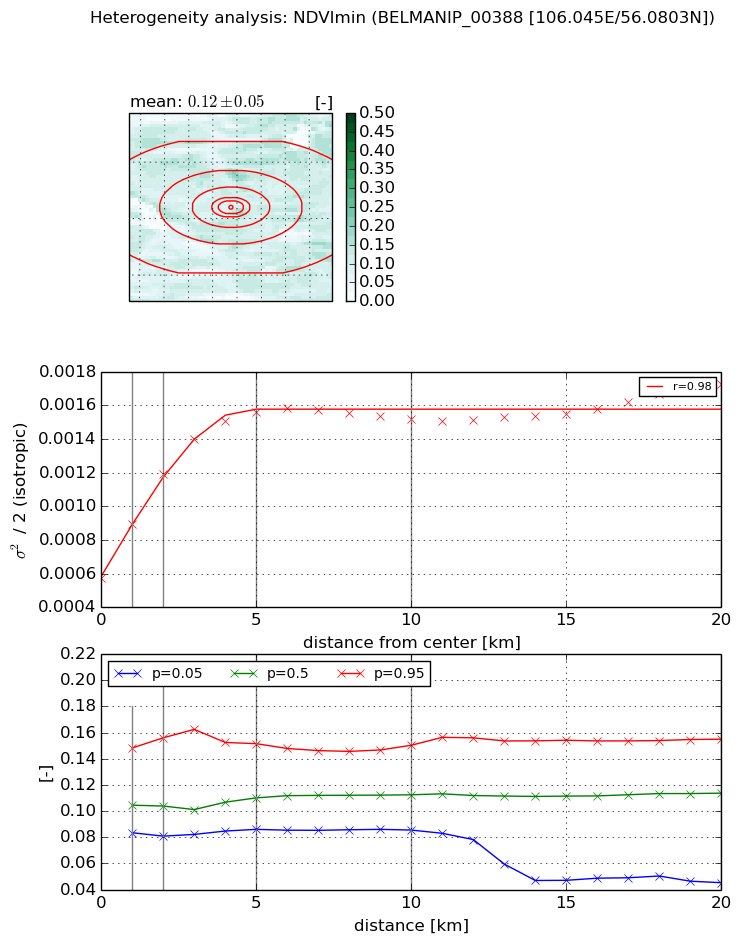
Heterogeneity analysis

The heterogeneity analysis provides information about the spatial and temporal heterogeneity of the site.

Topography


Roman et al. (2009) index


St

2.68314756324

Rcv

0.471541682767

Rse

0.0

Rst

-0.0542734548902

Rsv

0.592274691281


Height range @ 1km [m]

118

Height range @ 2km [m]

179

Height range @ 5km [m]

391

Height range @ 10km [m]

-999

Height range @ 20km [m]

-999


Variance slope @ 1 km

4498

Variance slope @ 2 km

5355

Variance slope @ 5 km

3495

Variance slope @ 10 km

-999

Variance slope @ 20 km

-999


NDVI (max. NDVI composite)


Roman et al. (2009) index


St

1.19652656831e-07

Rcv

0.545439584785

Rse

0.0

Rst

0.109778272426

Rsv

25072572.57


NDVI range @ 1km [-]

0.02

NDVI range @ 2km [-]

0.04

NDVI range @ 5km [-]

0.12

NDVI range @ 10km [-]

0.16

NDVI range @ 20km [-]

0.15


Variance slope @ 1 km

0.000130842313734

Variance slope @ 2 km

0.000153378411311

Variance slope @ 5 km

0.000187239308516

Variance slope @ 10 km

0.000183869396478

Variance slope @ 20 km

0.000122251742554


NDVI (min. NDVI composite)I


Roman et al. (2009) index


St

5.80794785217

Rcv

-0.22943899839

Rse

0.0

Rst

0.0503029776632

Rsv

-0.236791587325


NDVI range @ 1km [-]

0.06

NDVI range @ 2km [-]

0.08

NDVI range @ 5km [-]

0.07

NDVI range @ 10km [-]

0.06

NDVI range @ 20km [-]

0.11


NDVI slope @ 1 km

0.000320410566874

NDVI slope @ 2 km

0.000308787477884

NDVI slope @ 5 km

0.000199672445202

NDVI slope @ 10 km

7.97887784532e-05

NDVI slope @ 20 km

3.1262814072e-05


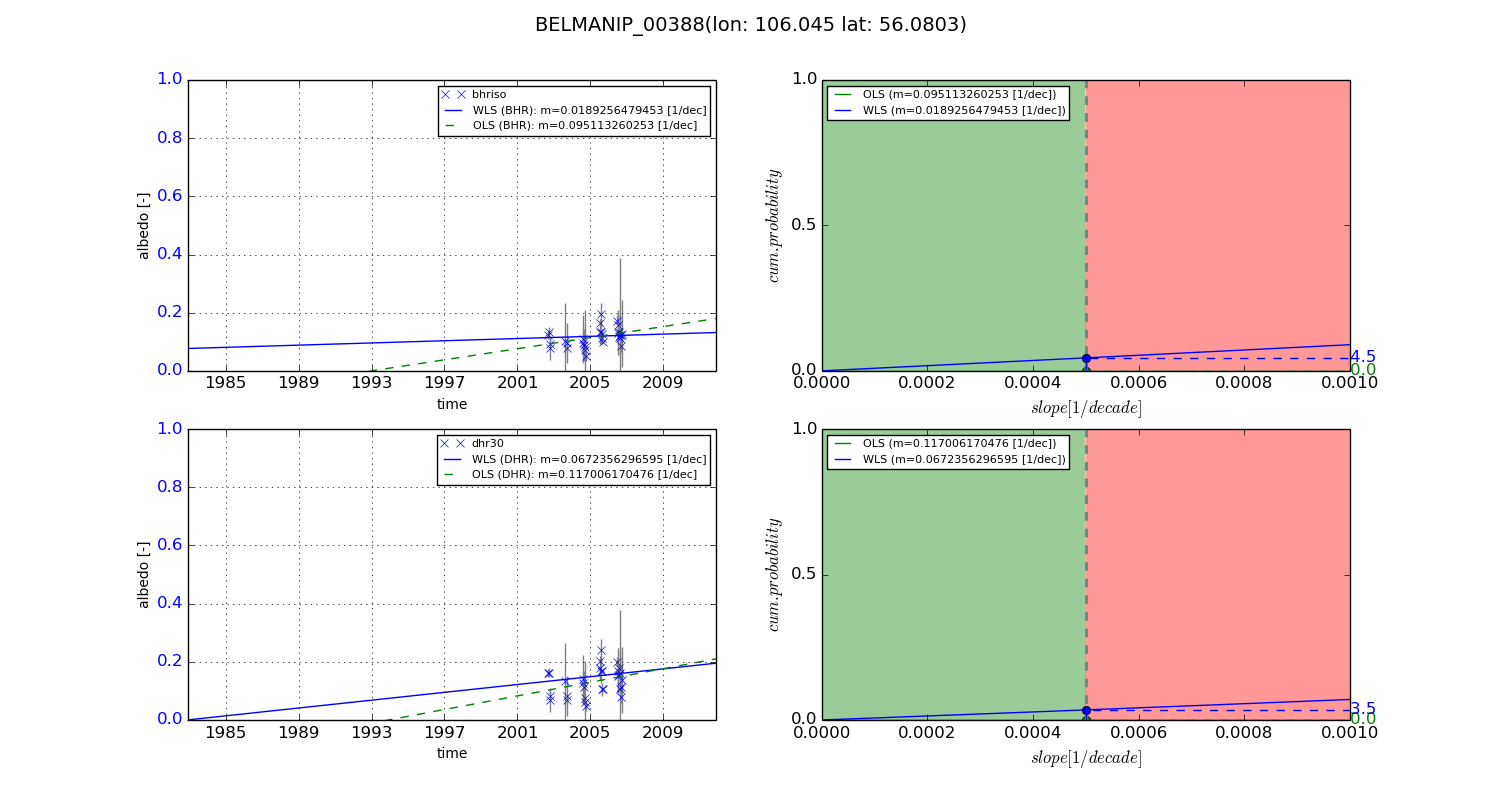
Temporal stability analysis

+000 deg (BHR)


BHR statistics

Temporal stability [1/decade]:


abs

rel


Weighted least square:

None


Ordinary least square:

None


Probabilities that GCOS criteria is met:

Weighted least square:

None %

Ordinary least square:

None %


DHR statistics

Temporal stability [1/decade]:


abs

rel


Weighted least square:

None


Ordinary least square:

None


Probabilities that GCOS criteria is met:

Weighted least square:

None %

Ordinary least square:

None %


+057/+063 deg (BHR)


BHR statistics

Temporal stability [1/decade]:


abs

rel


Weighted least square:

0.0189256479453


Ordinary least square:

0.095113260253


Probabilities that GCOS criteria is met:

Weighted least square:

4.5 %

Ordinary least square:

0.0 %


DHR statistics

Temporal stability [1/decade]:


abs

rel


Weighted least square:

0.0672356296595


Ordinary least square:

0.117006170476


Probabilities that GCOS criteria is met:

Weighted least square:

3.5 %

Ordinary least square:

0.0 %


Temporal anomaly analyis

The variance of the temporal anomalies provides an additional measure about the stability of the signal AFTER removal of the mean seasonal cylce.

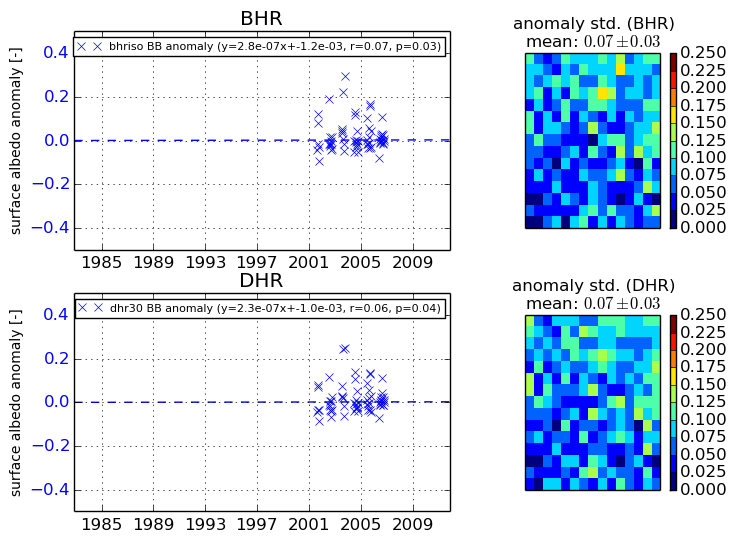
+000 deg


+057/+063 deg