BELMANIP_00389


Location

lon / lat [deg]: 107.5389 / 59.0483

Source network: BELMANIP


Geostationary surface albedo (GSA) data


“+000”


“+057/+063”


Landcover information (based on ESA CCI landcover data)


Landcover fractions @ 2km distance


Landcover fractions @ 20 km distance


Legend


Distance to open water bodies [km]:

24.64

Distance to urban areas [km]:

none in region


Radius: 1 km

Number of landcover classes:

2

Dominant landcover type:

80: Tree cover, needleleaved, deciduous, closed to open (>15%)

Fraction of dominant landcover type [%]:

94.0


Radius: 2 km

Number of landcover classes:

2

Dominant landcover type:

80: Tree cover, needleleaved, deciduous, closed to open (>15%)

Fraction of dominant landcover type [%]:

86.0


Radius: 5 km

Number of landcover classes:

2

Dominant landcover type:

80: Tree cover, needleleaved, deciduous, closed to open (>15%)

Fraction of dominant landcover type [%]:

87.0


Radius: 10 km

Number of landcover classes:

3

Dominant landcover type:

80: Tree cover, needleleaved, deciduous, closed to open (>15%)

Fraction of dominant landcover type [%]:

91.0


Radius: 20 km

Number of landcover classes:

4

Dominant landcover type:

80: Tree cover, needleleaved, deciduous, closed to open (>15%)

Fraction of dominant landcover type [%]:

72.0


Disturbances


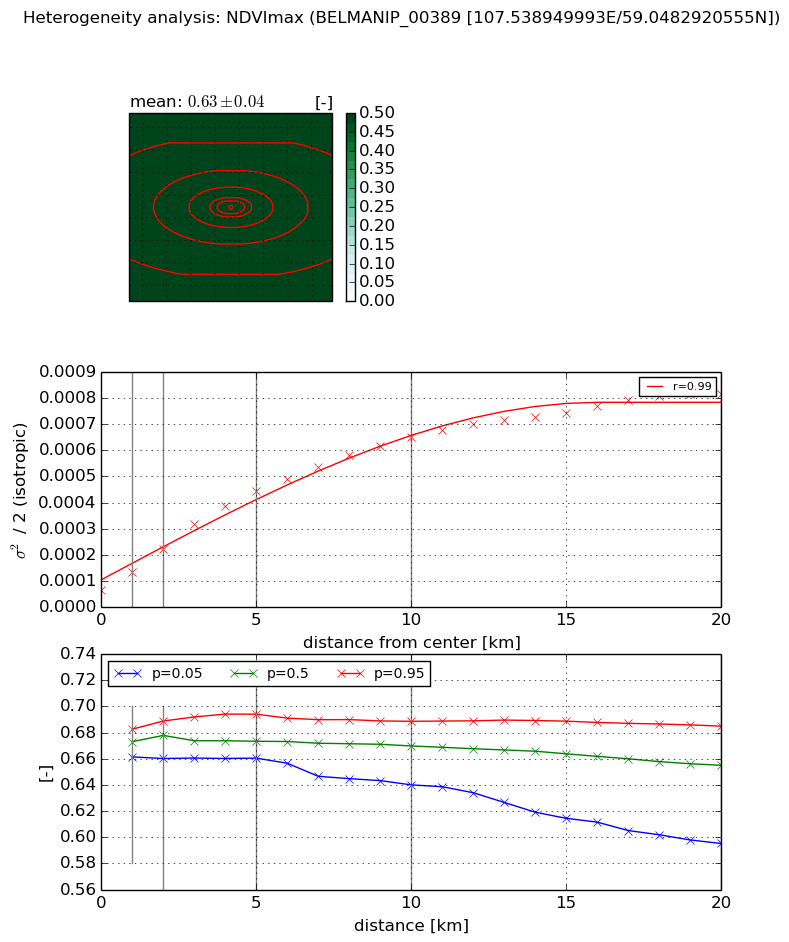
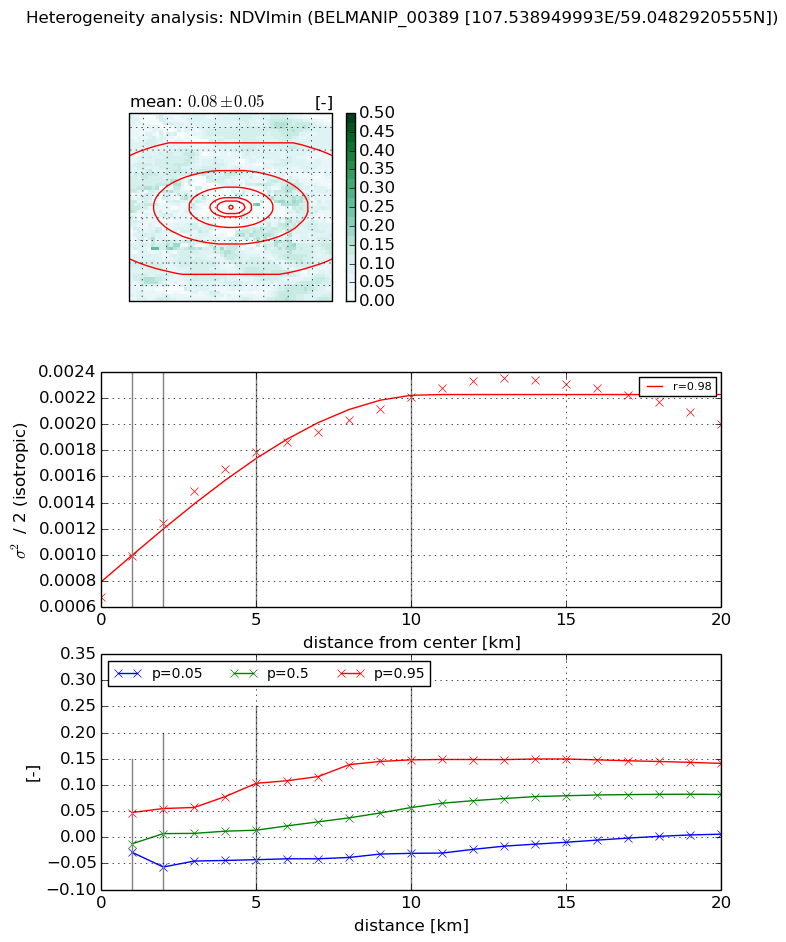
Heterogeneity analysis

The heterogeneity analysis provides information about the spatial and temporal heterogeneity of the site.

Topography


Roman et al. (2009) index


St

6.56955858641

Rcv

0.0461551660216

Rse

0.0

Rst

-0.0735277435458

Rsv

0.336968775708


Height range @ 1km [m]

54

Height range @ 2km [m]

71

Height range @ 5km [m]

85

Height range @ 10km [m]

-999

Height range @ 20km [m]

-999


Variance slope @ 1 km

223

Variance slope @ 2 km

230

Variance slope @ 5 km

158

Variance slope @ 10 km

-999

Variance slope @ 20 km

-999


NDVI (max. NDVI composite)


Roman et al. (2009) index


St

25.4397034527

Rcv

-0.0329234627181

Rse

0.0

Rst

-0.0551884879204

Rsv

-0.0298139522941


NDVI range @ 1km [-]

0.02

NDVI range @ 2km [-]

0.03

NDVI range @ 5km [-]

0.03

NDVI range @ 10km [-]

0.05

NDVI range @ 20km [-]

0.09


Variance slope @ 1 km

6.89261704412e-05

Variance slope @ 2 km

7.82788602646e-05

Variance slope @ 5 km

7.84805337554e-05

Variance slope @ 10 km

5.86812922025e-05

Variance slope @ 20 km

3.52692490401e-05


NDVI (min. NDVI composite)I


Roman et al. (2009) index


St

nan

Rcv

nan

Rse

nan

Rst

nan

Rsv

nan


NDVI range @ 1km [-]

0.08

NDVI range @ 2km [-]

0.11

NDVI range @ 5km [-]

0.15

NDVI range @ 10km [-]

0.18

NDVI range @ 20km [-]

0.14


NDVI slope @ 1 km

0.00031093730411

NDVI slope @ 2 km

0.000283918382099

NDVI slope @ 5 km

0.000222326714817

NDVI slope @ 10 km

0.000141764359919

NDVI slope @ 20 km

5.96345566849e-05


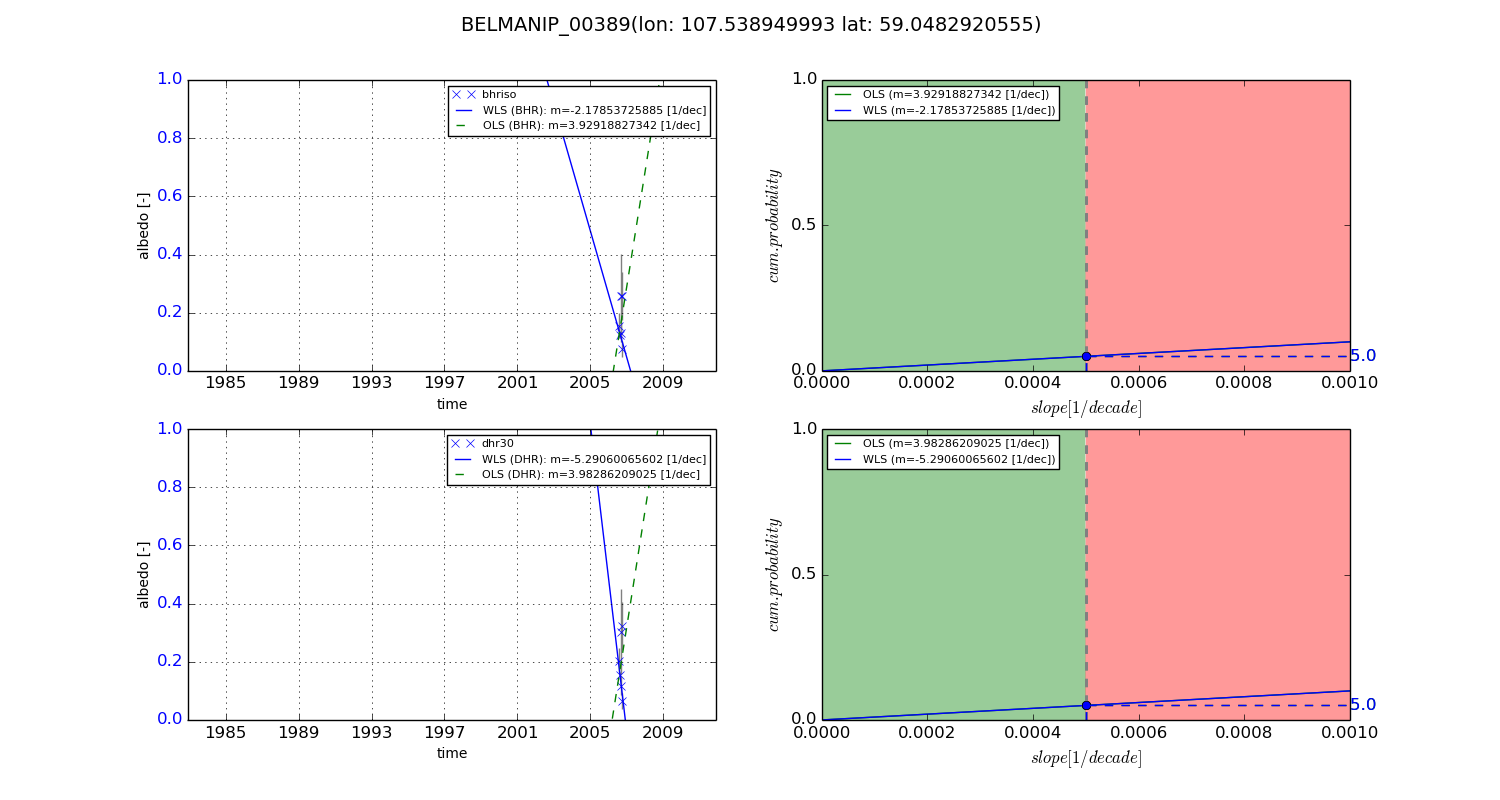
Temporal stability analysis

+000 deg (BHR)


BHR statistics

Temporal stability [1/decade]:


abs

rel


Weighted least square:

None


Ordinary least square:

None


Probabilities that GCOS criteria is met:

Weighted least square:

None %

Ordinary least square:

None %


DHR statistics

Temporal stability [1/decade]:


abs

rel


Weighted least square:

None


Ordinary least square:

None


Probabilities that GCOS criteria is met:

Weighted least square:

None %

Ordinary least square:

None %


+057/+063 deg (BHR)


BHR statistics

Temporal stability [1/decade]:


abs

rel


Weighted least square:

-2.17853725885


Ordinary least square:

3.92918827342


Probabilities that GCOS criteria is met:

Weighted least square:

5.0 %

Ordinary least square:

5.0 %


DHR statistics

Temporal stability [1/decade]:


abs

rel


Weighted least square:

-5.29060065602


Ordinary least square:

3.98286209025


Probabilities that GCOS criteria is met:

Weighted least square:

5.0 %

Ordinary least square:

5.0 %


Temporal anomaly analyis

The variance of the temporal anomalies provides an additional measure about the stability of the signal AFTER removal of the mean seasonal cylce.

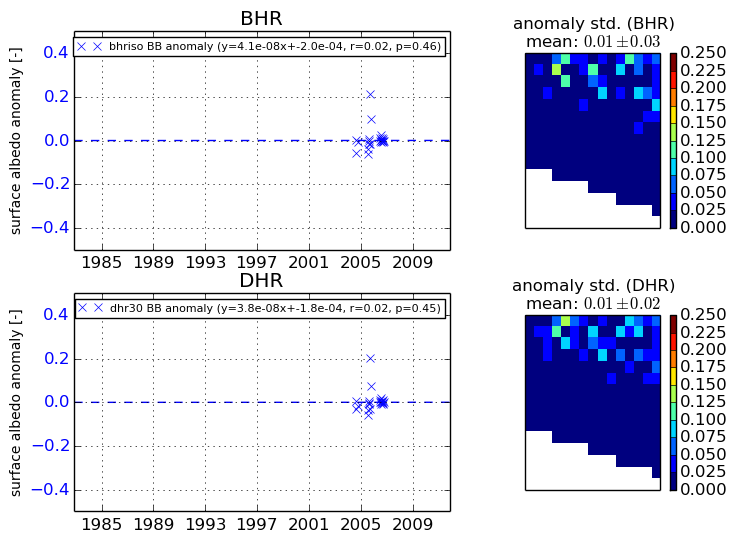
+000 deg


+057/+063 deg