BELMANIP_00392


Location

lon / lat [deg]: 123.367 / 51.068

Source network: BELMANIP


Geostationary surface albedo (GSA) data


“+000”


“+057/+063”


Landcover information (based on ESA CCI landcover data)


Landcover fractions @ 2km distance


Landcover fractions @ 20 km distance


Legend


Distance to open water bodies [km]:

none in region

Distance to urban areas [km]:

7.03


Radius: 1 km

Number of landcover classes:

1

Dominant landcover type:

80: Tree cover, needleleaved, deciduous, closed to open (>15%)

Fraction of dominant landcover type [%]:

100.0


Radius: 2 km

Number of landcover classes:

1

Dominant landcover type:

80: Tree cover, needleleaved, deciduous, closed to open (>15%)

Fraction of dominant landcover type [%]:

100.0


Radius: 5 km

Number of landcover classes:

1

Dominant landcover type:

80: Tree cover, needleleaved, deciduous, closed to open (>15%)

Fraction of dominant landcover type [%]:

98.0


Radius: 10 km

Number of landcover classes:

3

Dominant landcover type:

80: Tree cover, needleleaved, deciduous, closed to open (>15%)

Fraction of dominant landcover type [%]:

91.0


Radius: 20 km

Number of landcover classes:

4

Dominant landcover type:

80: Tree cover, needleleaved, deciduous, closed to open (>15%)

Fraction of dominant landcover type [%]:

90.0


Disturbances


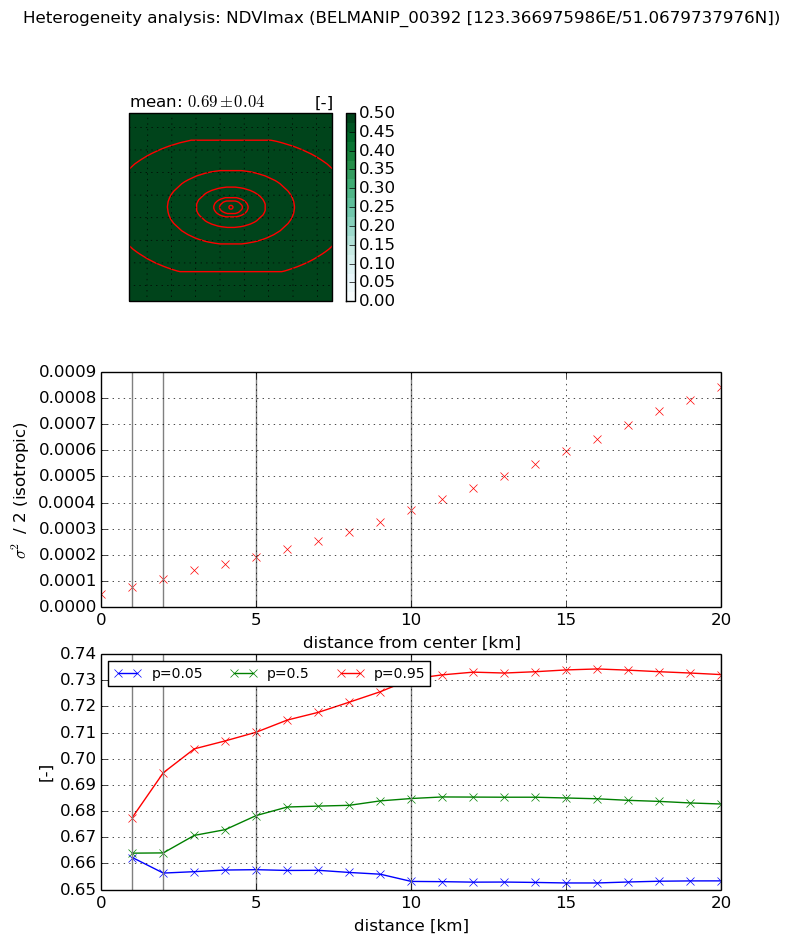
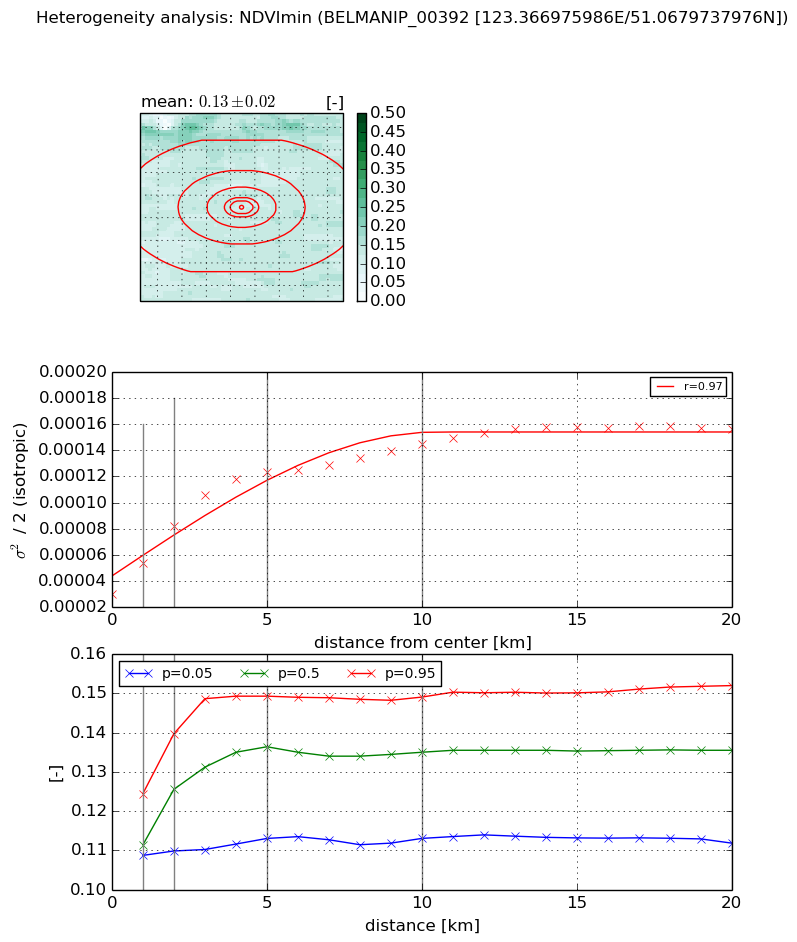
Heterogeneity analysis

The heterogeneity analysis provides information about the spatial and temporal heterogeneity of the site.

Topography


Roman et al. (2009) index


St

4.18415446705

Rcv

0.192371090629

Rse

0.0

Rst

-0.0893425165285

Rsv

0.435277131026


Height range @ 1km [m]

157

Height range @ 2km [m]

207

Height range @ 5km [m]

249

Height range @ 10km [m]

-999

Height range @ 20km [m]

-999


Variance slope @ 1 km

4204

Variance slope @ 2 km

2974

Variance slope @ 5 km

1188

Variance slope @ 10 km

-999

Variance slope @ 20 km

-999


NDVI (max. NDVI composite)


Roman et al. (2009) index


St

2.58974593972

Rcv

0.142403355249

Rse

0.0

Rst

-0.0160118310868

Rsv

-0.999999604084


NDVI range @ 1km [-]

0.02

NDVI range @ 2km [-]

0.04

NDVI range @ 5km [-]

0.05

NDVI range @ 10km [-]

0.08

NDVI range @ 20km [-]

0.08


Variance slope @ 1 km

2.87689623718e-05

Variance slope @ 2 km

3.03754270508e-05

Variance slope @ 5 km

2.8912625637e-05

Variance slope @ 10 km

3.10874769911e-05

Variance slope @ 20 km

4.0009578817e-05


NDVI (min. NDVI composite)I


Roman et al. (2009) index


St

7.78728250237

Rcv

-0.113520628828

Rse

0.0

Rst

-0.0810451880637

Rsv

0.190677687384


NDVI range @ 1km [-]

0.02

NDVI range @ 2km [-]

0.03

NDVI range @ 5km [-]

0.04

NDVI range @ 10km [-]

0.04

NDVI range @ 20km [-]

0.04


NDVI slope @ 1 km

2.3403915707e-05

NDVI slope @ 2 km

2.61244001584e-05

NDVI slope @ 5 km

1.95491980852e-05

NDVI slope @ 10 km

1.02307226724e-05

NDVI slope @ 20 km

4.98988948711e-06


Temporal stability analysis

+000 deg (BHR)


BHR statistics

Temporal stability [1/decade]:


abs

rel


Weighted least square:

None


Ordinary least square:

None


Probabilities that GCOS criteria is met:

Weighted least square:

None %

Ordinary least square:

None %


DHR statistics

Temporal stability [1/decade]:


abs

rel


Weighted least square:

None


Ordinary least square:

None


Probabilities that GCOS criteria is met:

Weighted least square:

None %

Ordinary least square:

None %


+057/+063 deg (BHR)


BHR statistics

Temporal stability [1/decade]:


abs

rel


Weighted least square:

-99999.0


Ordinary least square:

-99999.0


Probabilities that GCOS criteria is met:

Weighted least square:

-99999.0 %

Ordinary least square:

-99999.0 %


DHR statistics

Temporal stability [1/decade]:


abs

rel


Weighted least square:

-99999.0


Ordinary least square:

-99999.0


Probabilities that GCOS criteria is met:

Weighted least square:

-99999.0 %

Ordinary least square:

-99999.0 %


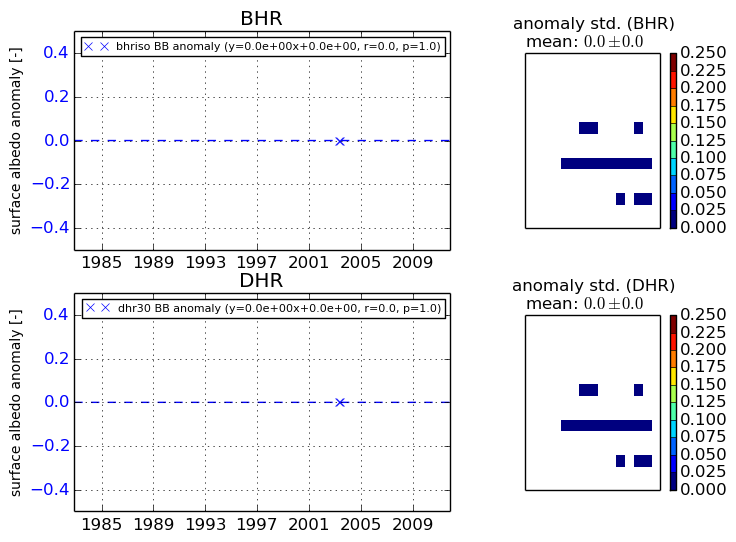
Temporal anomaly analyis

The variance of the temporal anomalies provides an additional measure about the stability of the signal AFTER removal of the mean seasonal cylce.

+000 deg


+057/+063 deg