BELMANIP_00397


Location

lon / lat [deg]: 69.5315 / 56.5167

Source network: BELMANIP


Geostationary surface albedo (GSA) data


“+000”


“+057/+063”


Landcover information (based on ESA CCI landcover data)


Landcover fractions @ 2km distance


Landcover fractions @ 20 km distance


Legend


Distance to open water bodies [km]:

18.65

Distance to urban areas [km]:

18.73


Radius: 1 km

Number of landcover classes:

3

Dominant landcover type:

60: Tree cover, broadleaved, decidous

Fraction of dominant landcover type [%]:

45.0


Radius: 2 km

Number of landcover classes:

4

Dominant landcover type:

130: grassland

Fraction of dominant landcover type [%]:

47.0


Radius: 5 km

Number of landcover classes:

6

Dominant landcover type:

130: grassland

Fraction of dominant landcover type [%]:

60.0


Radius: 10 km

Number of landcover classes:

7

Dominant landcover type:

130: grassland

Fraction of dominant landcover type [%]:

61.0


Radius: 20 km

Number of landcover classes:

7

Dominant landcover type:

130: grassland

Fraction of dominant landcover type [%]:

48.0


Disturbances


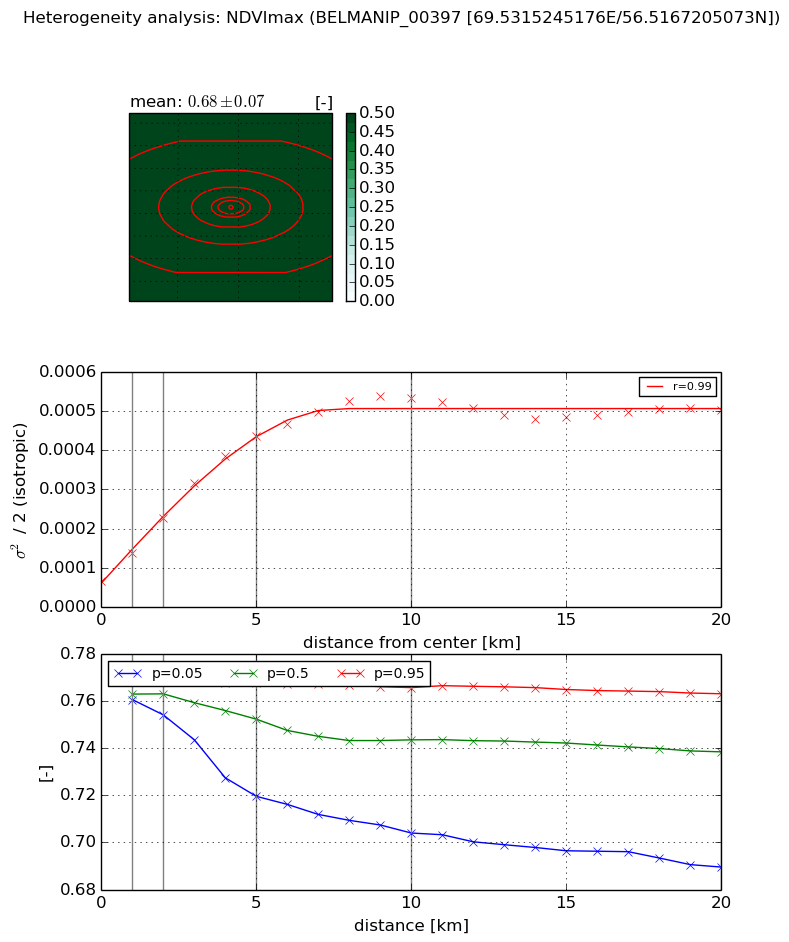
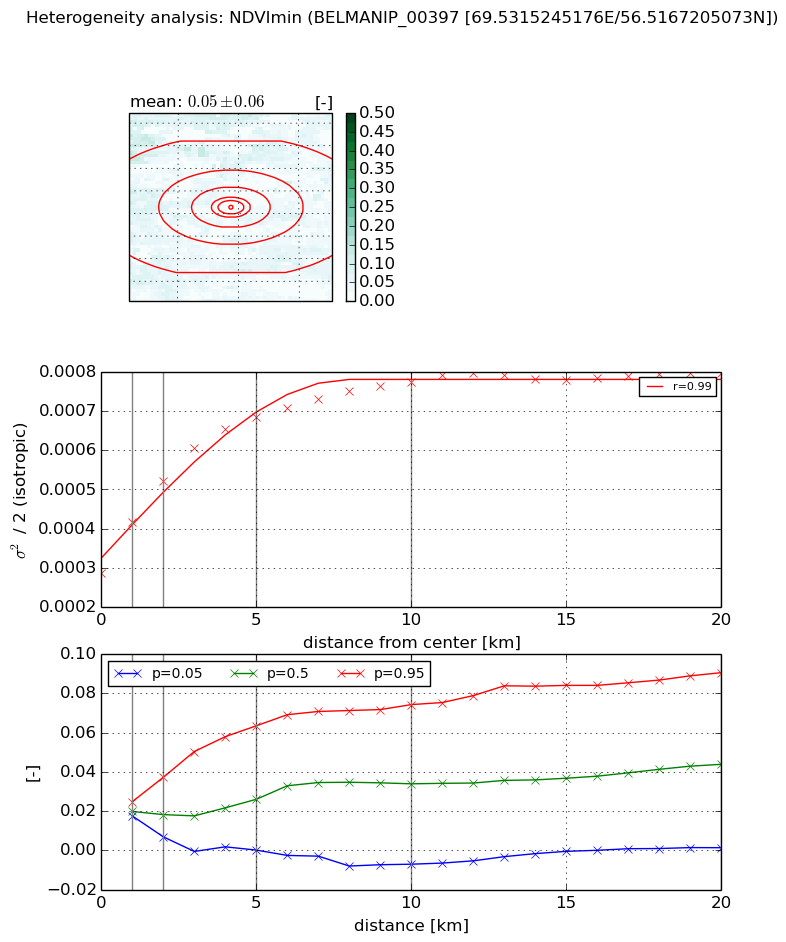
Heterogeneity analysis

The heterogeneity analysis provides information about the spatial and temporal heterogeneity of the site.

Topography


Roman et al. (2009) index


St

2.52844534444

Rcv

0.121759347916

Rse

0.0

Rst

-0.1655035516

Rsv

0.899236941819


Height range @ 1km [m]

7

Height range @ 2km [m]

7

Height range @ 5km [m]

7

Height range @ 10km [m]

-999

Height range @ 20km [m]

-999


Variance slope @ 1 km

3

Variance slope @ 2 km

1

Variance slope @ 5 km

0

Variance slope @ 10 km

-999

Variance slope @ 20 km

-999


NDVI (max. NDVI composite)


Roman et al. (2009) index


St

2.34501264141

Rcv

0.856306358432

Rse

0.0

Rst

-0.194010477715

Rsv

-0.228993964581


NDVI range @ 1km [-]

0.01

NDVI range @ 2km [-]

0.02

NDVI range @ 5km [-]

0.05

NDVI range @ 10km [-]

0.06

NDVI range @ 20km [-]

0.07


Variance slope @ 1 km

7.0084114375e-05

Variance slope @ 2 km

7.93274091446e-05

Variance slope @ 5 km

7.66461365566e-05

Variance slope @ 10 km

4.79456454474e-05

Variance slope @ 20 km

1.56604273444e-05


NDVI (min. NDVI composite)I


Roman et al. (2009) index


St

29.6834407049

Rcv

-0.0361320057611

Rse

0.0

Rst

-0.0412408488609

Rsv

0.0236935961923


NDVI range @ 1km [-]

0.01

NDVI range @ 2km [-]

0.03

NDVI range @ 5km [-]

0.06

NDVI range @ 10km [-]

0.08

NDVI range @ 20km [-]

0.09


NDVI slope @ 1 km

0.000129579998645

NDVI slope @ 2 km

0.000116730047949

NDVI slope @ 5 km

7.96859744481e-05

NDVI slope @ 10 km

4.37061434998e-05

NDVI slope @ 20 km

1.79821869453e-05


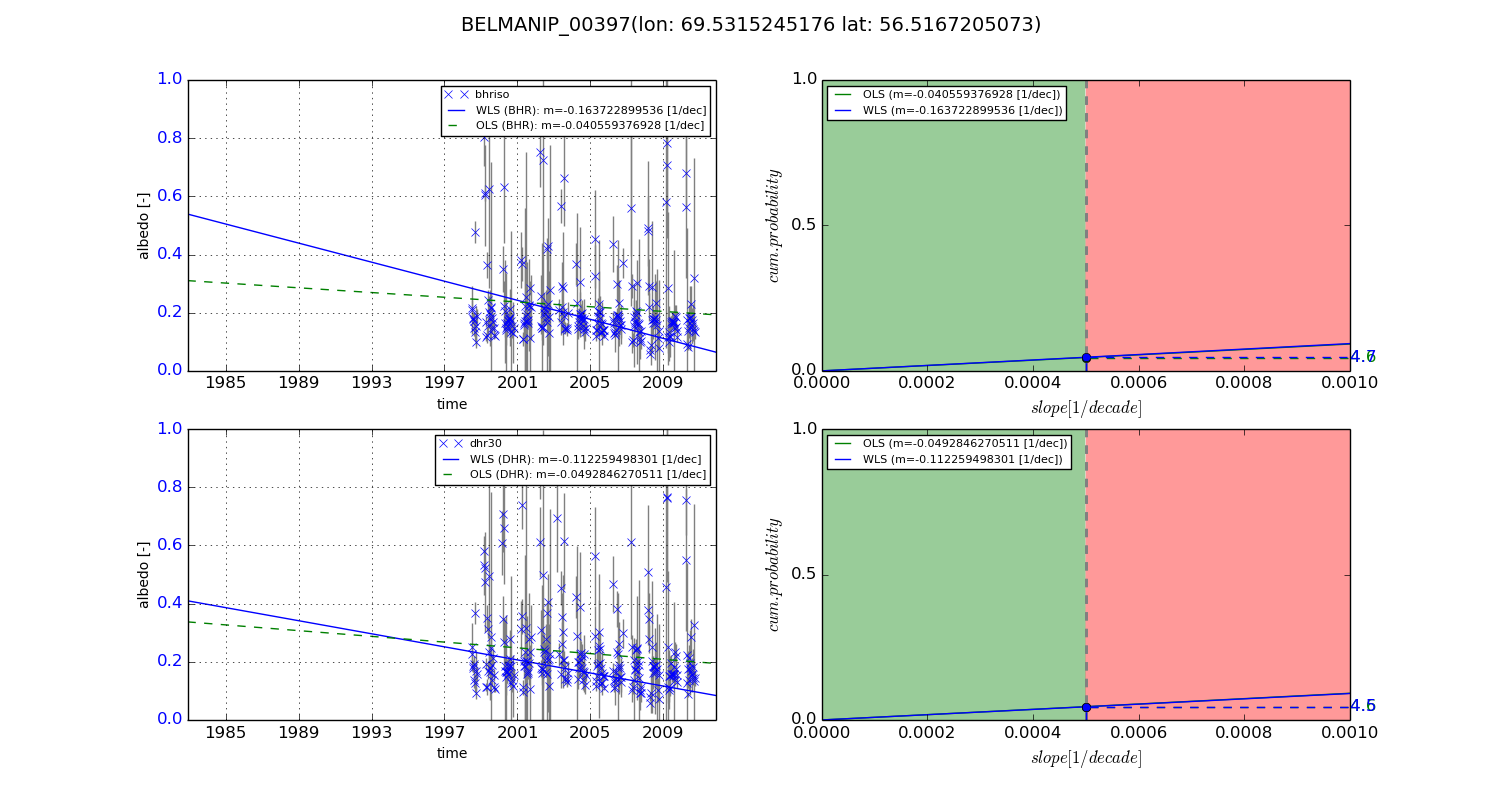
Temporal stability analysis

+000 deg (BHR)


BHR statistics

Temporal stability [1/decade]:


abs

rel


Weighted least square:

-99999.0


Ordinary least square:

-99999.0


Probabilities that GCOS criteria is met:

Weighted least square:

-99999.0 %

Ordinary least square:

-99999.0 %


DHR statistics

Temporal stability [1/decade]:


abs

rel


Weighted least square:

-99999.0


Ordinary least square:

-99999.0


Probabilities that GCOS criteria is met:

Weighted least square:

-99999.0 %

Ordinary least square:

-99999.0 %


+057/+063 deg (BHR)


BHR statistics

Temporal stability [1/decade]:


abs

rel


Weighted least square:

-0.163722899536


Ordinary least square:

-0.040559376928


Probabilities that GCOS criteria is met:

Weighted least square:

4.7 %

Ordinary least square:

4.6 %


DHR statistics

Temporal stability [1/decade]:


abs

rel


Weighted least square:

-0.112259498301


Ordinary least square:

-0.0492846270511


Probabilities that GCOS criteria is met:

Weighted least square:

4.5 %

Ordinary least square:

4.6 %


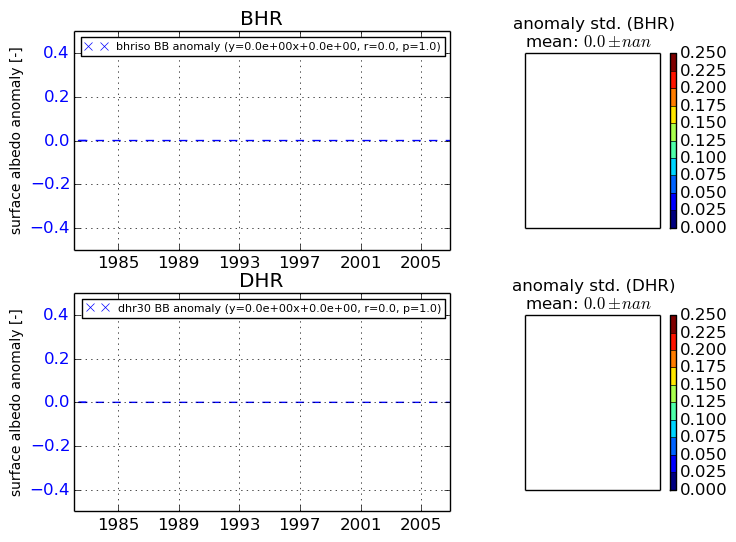
Temporal anomaly analyis

The variance of the temporal anomalies provides an additional measure about the stability of the signal AFTER removal of the mean seasonal cylce.
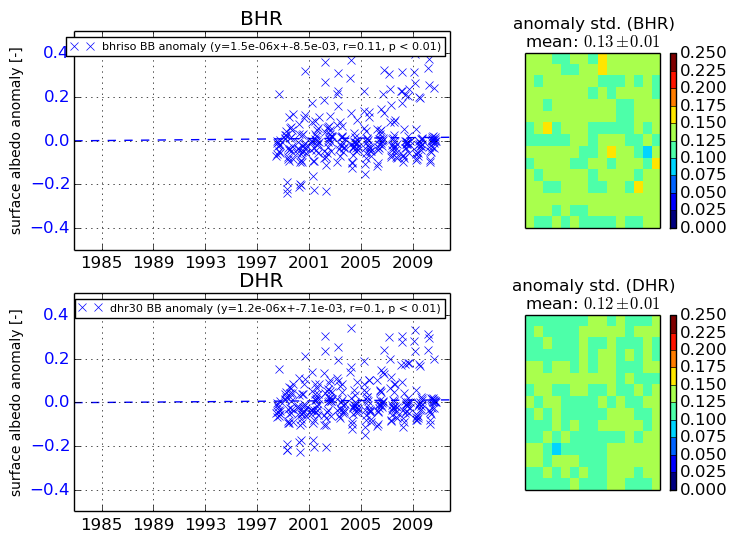
+000 deg


+057/+063 deg