BELMANIP_00399


Location

lon / lat [deg]: 67.8177 / 50.1459

Source network: BELMANIP


Geostationary surface albedo (GSA) data


“+000”


“+057/+063”


Landcover information (based on ESA CCI landcover data)


Landcover fractions @ 2km distance


Landcover fractions @ 20 km distance


Legend


Distance to open water bodies [km]:

7.57

Distance to urban areas [km]:

17.12


Radius: 1 km

Number of landcover classes:

1

Dominant landcover type:

130: grassland

Fraction of dominant landcover type [%]:

100.0


Radius: 2 km

Number of landcover classes:

1

Dominant landcover type:

130: grassland

Fraction of dominant landcover type [%]:

100.0


Radius: 5 km

Number of landcover classes:

2

Dominant landcover type:

130: grassland

Fraction of dominant landcover type [%]:

99.0


Radius: 10 km

Number of landcover classes:

2

Dominant landcover type:

130: grassland

Fraction of dominant landcover type [%]:

98.0


Radius: 20 km

Number of landcover classes:

1

Dominant landcover type:

130: grassland

Fraction of dominant landcover type [%]:

98.0


Disturbances


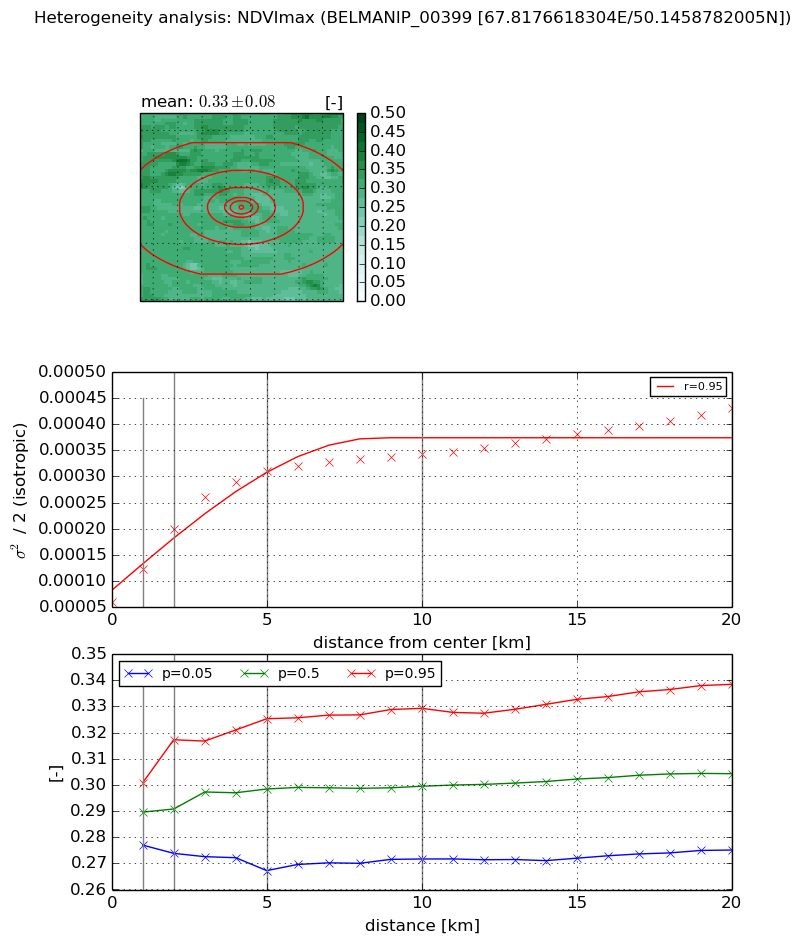
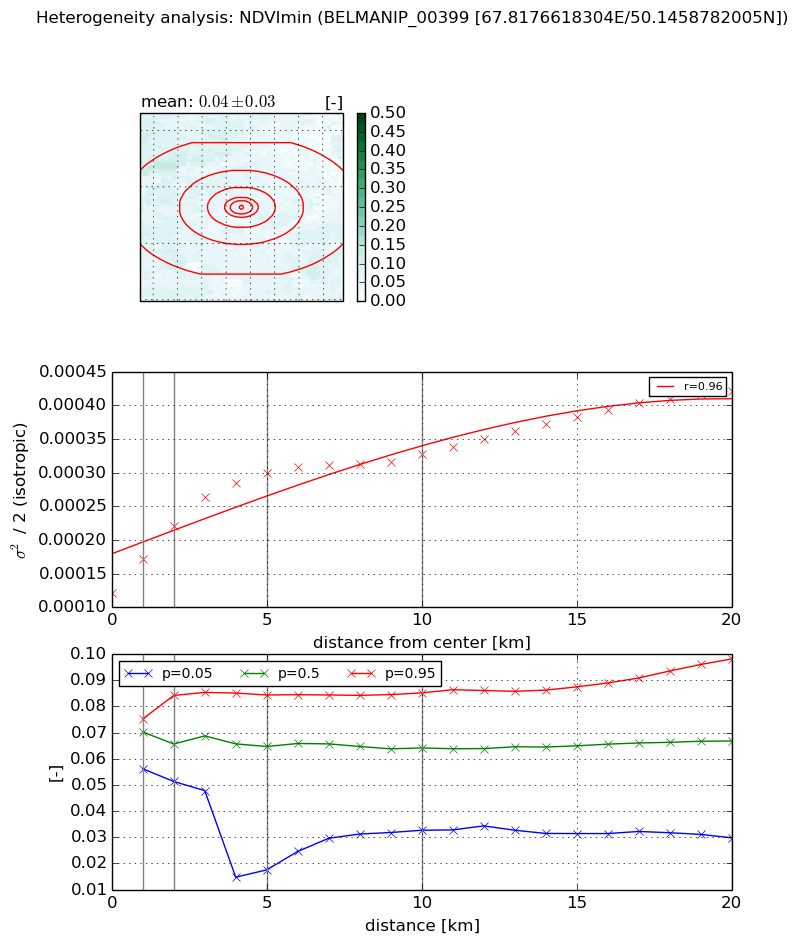
Heterogeneity analysis

The heterogeneity analysis provides information about the spatial and temporal heterogeneity of the site.

Topography


Roman et al. (2009) index


St

5.08077987552

Rcv

0.0841180119474

Rse

0.0

Rst

-0.0464059362395

Rsv

0.459936586121


Height range @ 1km [m]

41

Height range @ 2km [m]

54

Height range @ 5km [m]

66

Height range @ 10km [m]

-999

Height range @ 20km [m]

-999


Variance slope @ 1 km

85

Variance slope @ 2 km

113

Variance slope @ 5 km

96

Variance slope @ 10 km

-999

Variance slope @ 20 km

-999


NDVI (max. NDVI composite)


Roman et al. (2009) index


St

nan

Rcv

nan

Rse

nan

Rst

nan

Rsv

nan


NDVI range @ 1km [-]

0.02

NDVI range @ 2km [-]

0.04

NDVI range @ 5km [-]

0.06

NDVI range @ 10km [-]

0.06

NDVI range @ 20km [-]

0.06


Variance slope @ 1 km

6.40793434713e-05

Variance slope @ 2 km

6.98011591035e-05

Variance slope @ 5 km

5.17457980308e-05

Variance slope @ 10 km

2.57861329487e-05

Variance slope @ 20 km

1.33566597007e-05


NDVI (min. NDVI composite)I


Roman et al. (2009) index


St

5.01194492022e-06

Rcv

0.427172441915

Rse

0.0

Rst

0.0928080760955

Rsv

598569.505779


NDVI range @ 1km [-]

0.02

NDVI range @ 2km [-]

0.03

NDVI range @ 5km [-]

0.07

NDVI range @ 10km [-]

0.05

NDVI range @ 20km [-]

0.07


NDVI slope @ 1 km

4.93289181552e-05

NDVI slope @ 2 km

4.95659365382e-05

NDVI slope @ 5 km

3.63984569306e-05

NDVI slope @ 10 km

1.82095126539e-05

NDVI slope @ 20 km

1.20572995899e-05


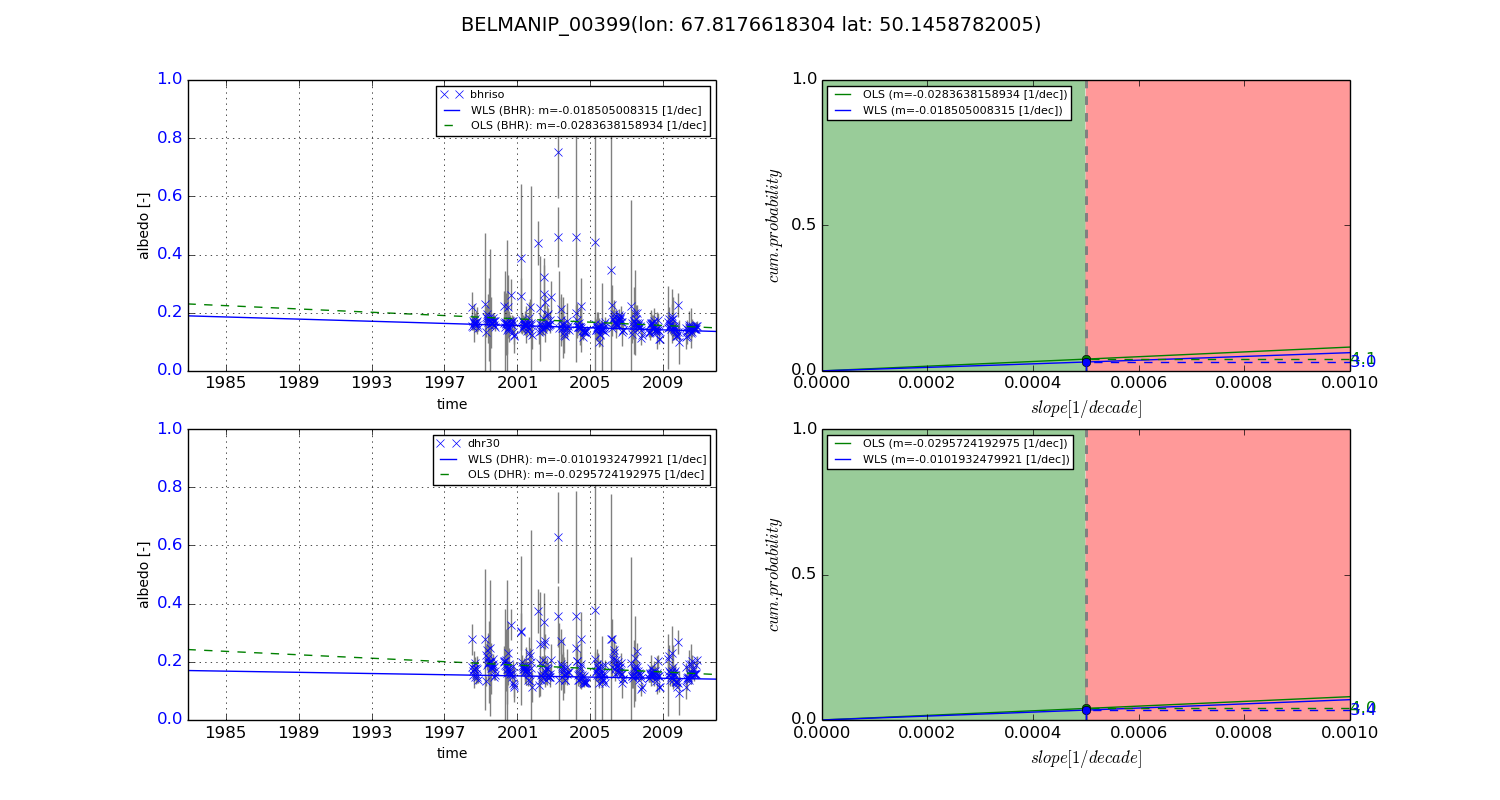
Temporal stability analysis

+000 deg (BHR)


BHR statistics

Temporal stability [1/decade]:


abs

rel


Weighted least square:

-99999.0


Ordinary least square:

-99999.0


Probabilities that GCOS criteria is met:

Weighted least square:

-99999.0 %

Ordinary least square:

-99999.0 %


DHR statistics

Temporal stability [1/decade]:


abs

rel


Weighted least square:

-99999.0


Ordinary least square:

-99999.0


Probabilities that GCOS criteria is met:

Weighted least square:

-99999.0 %

Ordinary least square:

-99999.0 %


+057/+063 deg (BHR)


BHR statistics

Temporal stability [1/decade]:


abs

rel


Weighted least square:

-0.018505008315


Ordinary least square:

-0.0283638158934


Probabilities that GCOS criteria is met:

Weighted least square:

3.0 %

Ordinary least square:

4.1 %


DHR statistics

Temporal stability [1/decade]:


abs

rel


Weighted least square:

-0.0101932479921


Ordinary least square:

-0.0295724192975


Probabilities that GCOS criteria is met:

Weighted least square:

3.4 %

Ordinary least square:

4.0 %


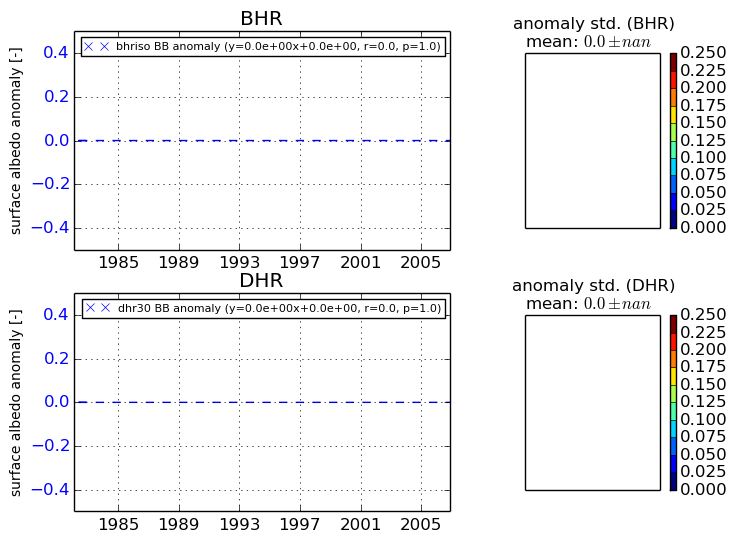
Temporal anomaly analyis

The variance of the temporal anomalies provides an additional measure about the stability of the signal AFTER removal of the mean seasonal cylce.
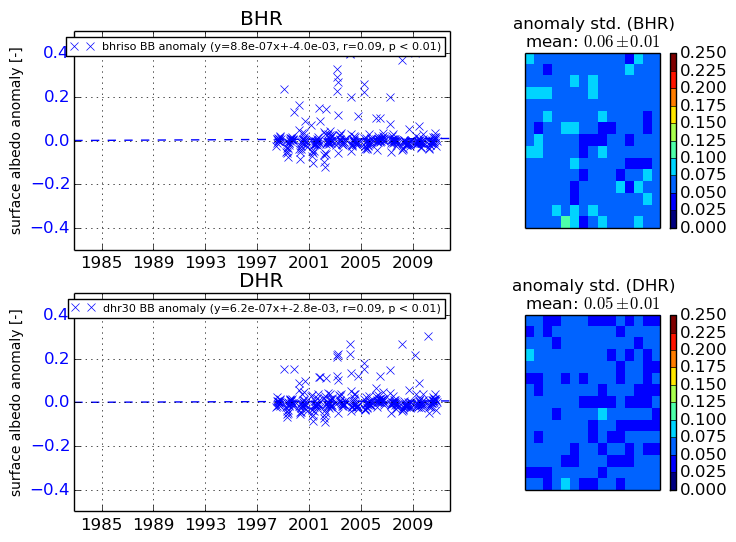
+000 deg


+057/+063 deg