BELMANIP_00401


Location

lon / lat [deg]: 80.6212 / 59.5513

Source network: BELMANIP


Geostationary surface albedo (GSA) data


“+000”


“+057/+063”


Landcover information (based on ESA CCI landcover data)


Landcover fractions @ 2km distance


Landcover fractions @ 20 km distance


Legend


Distance to open water bodies [km]:

6.01

Distance to urban areas [km]:

54.36


Radius: 1 km

Number of landcover classes:

1

Dominant landcover type:

180: shrub or herbaceous cover, flooded, fresh/saline/brakish water

Fraction of dominant landcover type [%]:

100.0


Radius: 2 km

Number of landcover classes:

1

Dominant landcover type:

180: shrub or herbaceous cover, flooded, fresh/saline/brakish water

Fraction of dominant landcover type [%]:

100.0


Radius: 5 km

Number of landcover classes:

4

Dominant landcover type:

180: shrub or herbaceous cover, flooded, fresh/saline/brakish water

Fraction of dominant landcover type [%]:

93.0


Radius: 10 km

Number of landcover classes:

4

Dominant landcover type:

180: shrub or herbaceous cover, flooded, fresh/saline/brakish water

Fraction of dominant landcover type [%]:

76.0


Radius: 20 km

Number of landcover classes:

4

Dominant landcover type:

180: shrub or herbaceous cover, flooded, fresh/saline/brakish water

Fraction of dominant landcover type [%]:

69.0


Disturbances


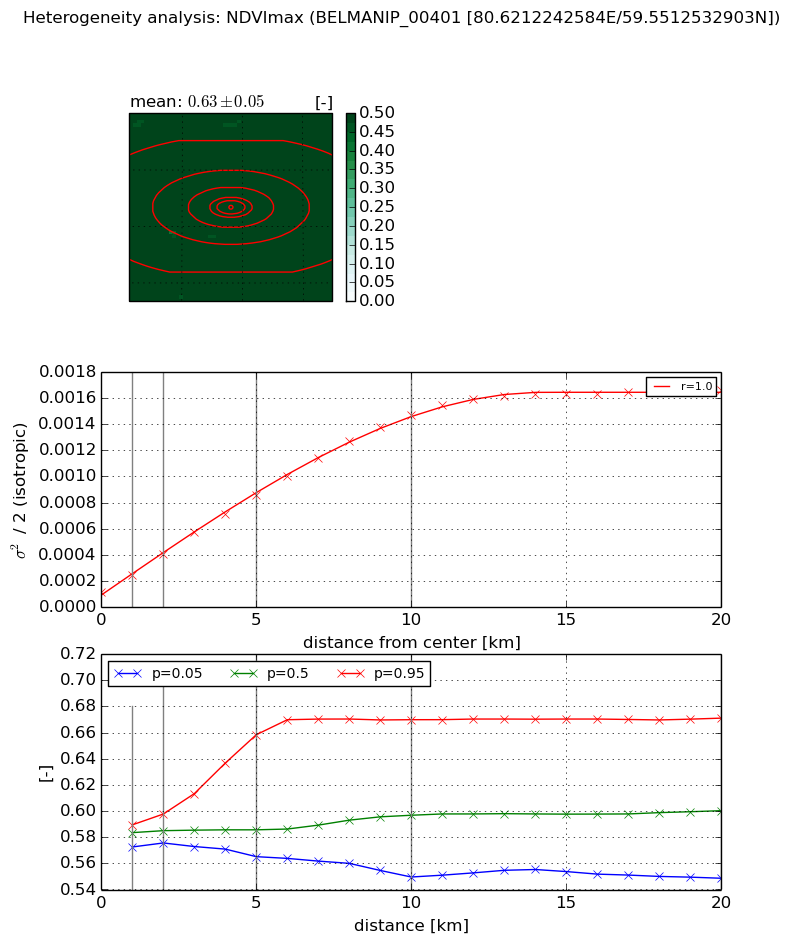
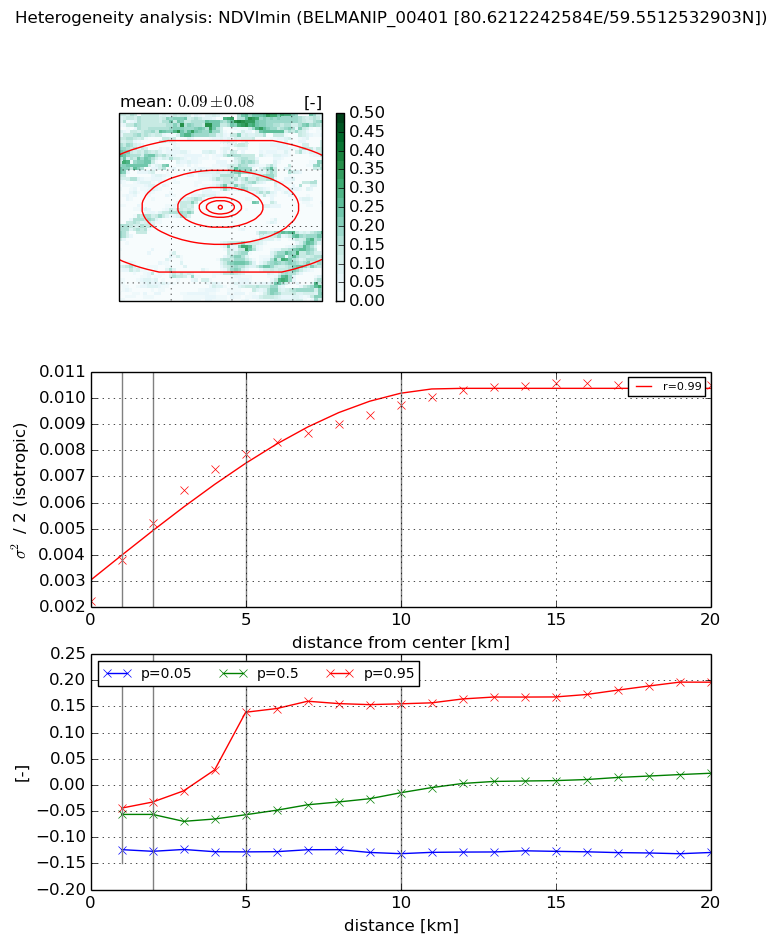
Heterogeneity analysis

The heterogeneity analysis provides information about the spatial and temporal heterogeneity of the site.

Topography


Roman et al. (2009) index


St

2.15902077589

Rcv

0.231959846146

Rse

0.0

Rst

-1.80460507244e-08

Rsv

1.15755895541


Height range @ 1km [m]

3

Height range @ 2km [m]

4

Height range @ 5km [m]

11

Height range @ 10km [m]

-999

Height range @ 20km [m]

-999


Variance slope @ 1 km

6

Variance slope @ 2 km

2

Variance slope @ 5 km

1

Variance slope @ 10 km

-999

Variance slope @ 20 km

-999


NDVI (max. NDVI composite)


Roman et al. (2009) index


St

0.107992058108

Rcv

1.09786443497

Rse

0.0

Rst

1.01930808131e-08

Rsv

26.6819561505


NDVI range @ 1km [-]

0.02

NDVI range @ 2km [-]

0.02

NDVI range @ 5km [-]

0.09

NDVI range @ 10km [-]

0.12

NDVI range @ 20km [-]

0.12


Variance slope @ 1 km

0.000129626993039

Variance slope @ 2 km

0.000145420741895

Variance slope @ 5 km

0.000150693292895

Variance slope @ 10 km

0.000138878830438

Variance slope @ 20 km

7.72855601822e-05


NDVI (min. NDVI composite)I


Roman et al. (2009) index


St

0.485426000582

Rcv

3.42572604797

Rse

0.0

Rst

-0.260349487531

Rsv

2.4940631394


NDVI range @ 1km [-]

0.08

NDVI range @ 2km [-]

0.09

NDVI range @ 5km [-]

0.27

NDVI range @ 10km [-]

0.29

NDVI range @ 20km [-]

0.33


NDVI slope @ 1 km

0.00155850164981

NDVI slope @ 2 km

0.00149545687914

NDVI slope @ 5 km

0.00113525501013

NDVI slope @ 10 km

0.000693603149127

NDVI slope @ 20 km

0.000340992941938


Temporal stability analysis

+000 deg (BHR)


BHR statistics

Temporal stability [1/decade]:


abs

rel


Weighted least square:

None


Ordinary least square:

None


Probabilities that GCOS criteria is met:

Weighted least square:

None %

Ordinary least square:

None %


DHR statistics

Temporal stability [1/decade]:


abs

rel


Weighted least square:

None


Ordinary least square:

None


Probabilities that GCOS criteria is met:

Weighted least square:

None %

Ordinary least square:

None %


+057/+063 deg (BHR)


BHR statistics

Temporal stability [1/decade]:


abs

rel


Weighted least square:

0.00142799898048


Ordinary least square:

-0.00723812508661


Probabilities that GCOS criteria is met:

Weighted least square:

7.3 %

Ordinary least square:

4.9 %


DHR statistics

Temporal stability [1/decade]:


abs

rel


Weighted least square:

0.00430236908744


Ordinary least square:

0.00624436517469


Probabilities that GCOS criteria is met:

Weighted least square:

3.6 %

Ordinary least square:

4.9 %


Temporal anomaly analyis

The variance of the temporal anomalies provides an additional measure about the stability of the signal AFTER removal of the mean seasonal cylce.

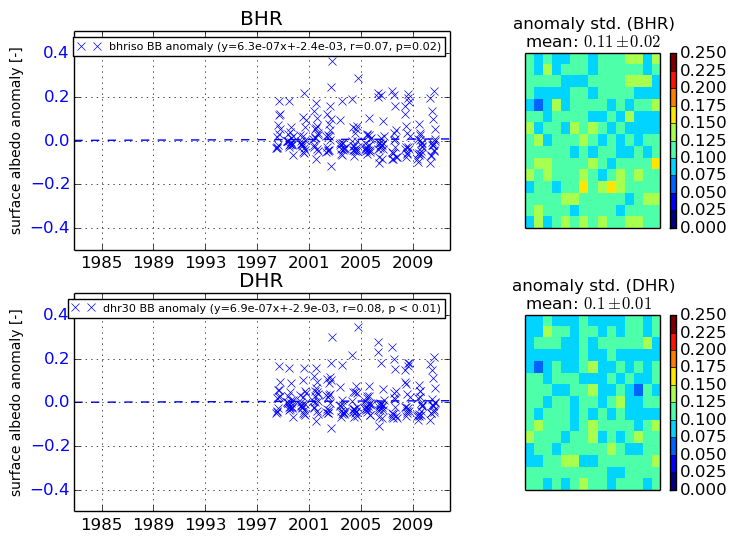
+000 deg


+057/+063 deg