BELMANIP_00404


Location

lon / lat [deg]: 70.5397 / 55.1923

Source network: BELMANIP


Geostationary surface albedo (GSA) data


“+000”


“+057/+063”


Landcover information (based on ESA CCI landcover data)


Landcover fractions @ 2km distance


Landcover fractions @ 20 km distance


Legend


Distance to open water bodies [km]:

2.26

Distance to urban areas [km]:

35.91


Radius: 1 km

Number of landcover classes:

4

Dominant landcover type:

10: cropland, rainfed

Fraction of dominant landcover type [%]:

52.0


Radius: 2 km

Number of landcover classes:

4

Dominant landcover type:

10: cropland, rainfed

Fraction of dominant landcover type [%]:

55.0


Radius: 5 km

Number of landcover classes:

5

Dominant landcover type:

10: cropland, rainfed

Fraction of dominant landcover type [%]:

53.0


Radius: 10 km

Number of landcover classes:

6

Dominant landcover type:

10: cropland, rainfed

Fraction of dominant landcover type [%]:

63.0


Radius: 20 km

Number of landcover classes:

5

Dominant landcover type:

10: cropland, rainfed

Fraction of dominant landcover type [%]:

65.0


Disturbances


Heterogeneity analysis

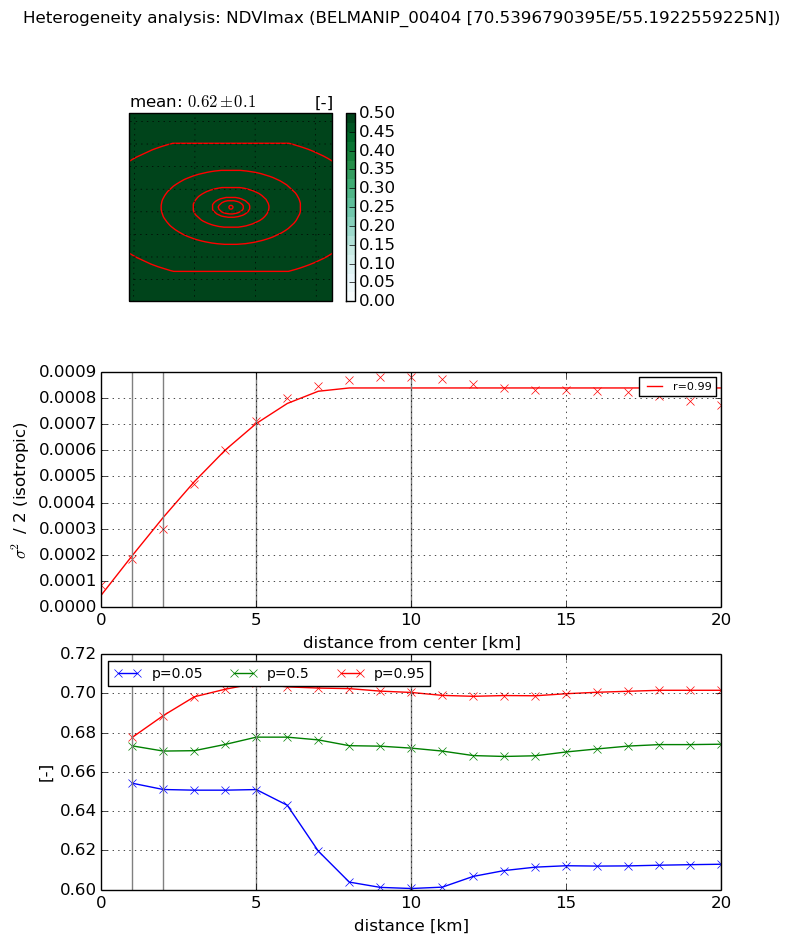
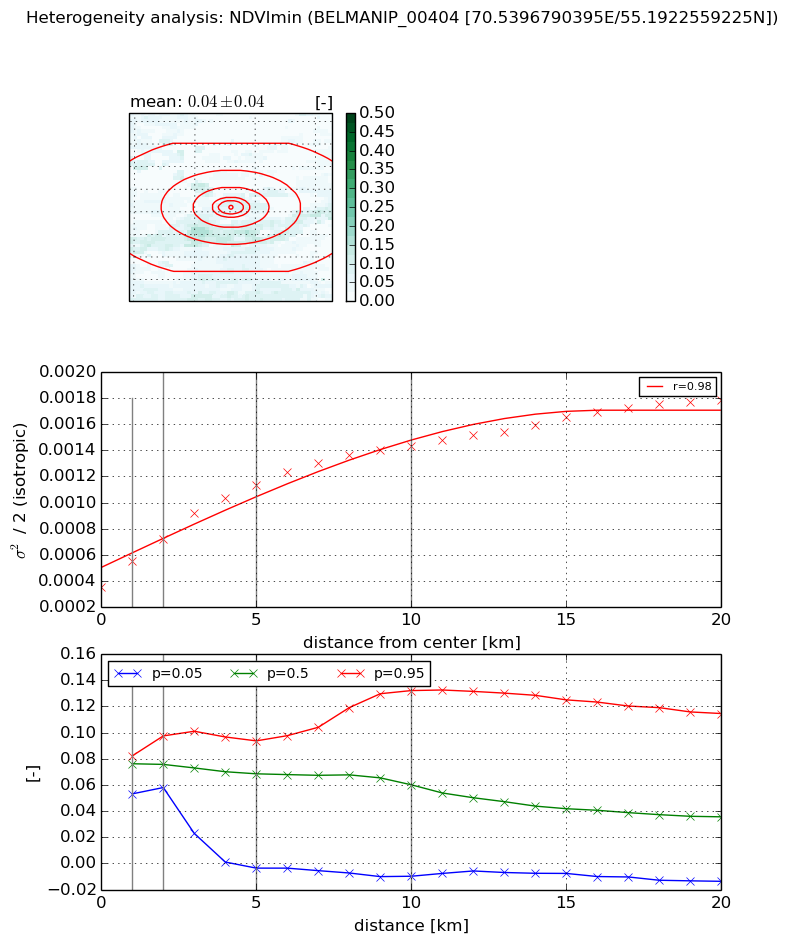
The heterogeneity analysis provides information about the spatial and temporal heterogeneity of the site.

Topography


Roman et al. (2009) index


St

8.54706694783

Rcv

-0.0825167631757

Rse

0.0

Rst

-0.139764750051

Rsv

0.128716088444


Height range @ 1km [m]

5

Height range @ 2km [m]

6

Height range @ 5km [m]

7

Height range @ 10km [m]

-999

Height range @ 20km [m]

-999


Variance slope @ 1 km

1

Variance slope @ 2 km

1

Variance slope @ 5 km

0

Variance slope @ 10 km

-999

Variance slope @ 20 km

-999


NDVI (max. NDVI composite)


Roman et al. (2009) index


St

8.28411812363

Rcv

0.139041538711

Rse

0.0

Rst

0.00265892560054

Rsv

0.220438263701


NDVI range @ 1km [-]

0.02

NDVI range @ 2km [-]

0.04

NDVI range @ 5km [-]

0.05

NDVI range @ 10km [-]

0.1

NDVI range @ 20km [-]

0.09


Variance slope @ 1 km

0.000101251577381

Variance slope @ 2 km

0.000108416213077

Variance slope @ 5 km

0.000130831118096

Variance slope @ 10 km

8.56305862536e-05

Variance slope @ 20 km

2.70526134858e-05


NDVI (min. NDVI composite)I


Roman et al. (2009) index


St

nan

Rcv

nan

Rse

nan

Rst

nan

Rsv

nan


NDVI range @ 1km [-]

0.03

NDVI range @ 2km [-]

0.04

NDVI range @ 5km [-]

0.1

NDVI range @ 10km [-]

0.14

NDVI range @ 20km [-]

0.13


NDVI slope @ 1 km

0.000196353739459

NDVI slope @ 2 km

0.000182384271093

NDVI slope @ 5 km

0.000158578417834

NDVI slope @ 10 km

0.000106322026935

NDVI slope @ 20 km

6.26522855915e-05


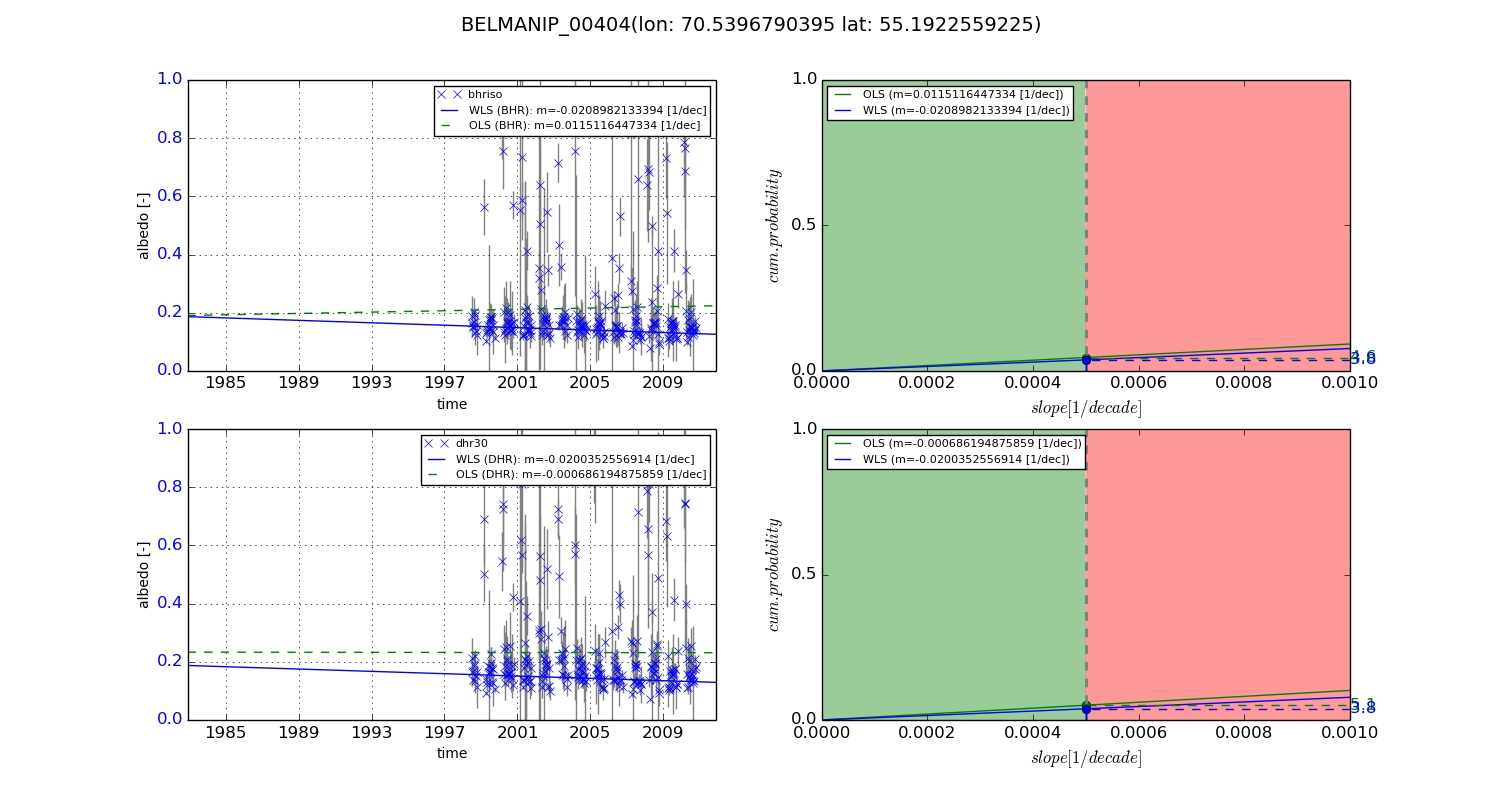
Temporal stability analysis

+000 deg (BHR)


BHR statistics

Temporal stability [1/decade]:


abs

rel


Weighted least square:

-99999.0


Ordinary least square:

-99999.0


Probabilities that GCOS criteria is met:

Weighted least square:

-99999.0 %

Ordinary least square:

-99999.0 %


DHR statistics

Temporal stability [1/decade]:


abs

rel


Weighted least square:

-99999.0


Ordinary least square:

-99999.0


Probabilities that GCOS criteria is met:

Weighted least square:

-99999.0 %

Ordinary least square:

-99999.0 %


+057/+063 deg (BHR)


BHR statistics

Temporal stability [1/decade]:


abs

rel


Weighted least square:

-0.0208982133394


Ordinary least square:

0.0115116447334


Probabilities that GCOS criteria is met:

Weighted least square:

3.8 %

Ordinary least square:

4.6 %


DHR statistics

Temporal stability [1/decade]:


abs

rel


Weighted least square:

-0.0200352556914


Ordinary least square:

-0.000686194875859


Probabilities that GCOS criteria is met:

Weighted least square:

3.8 %

Ordinary least square:

5.1 %


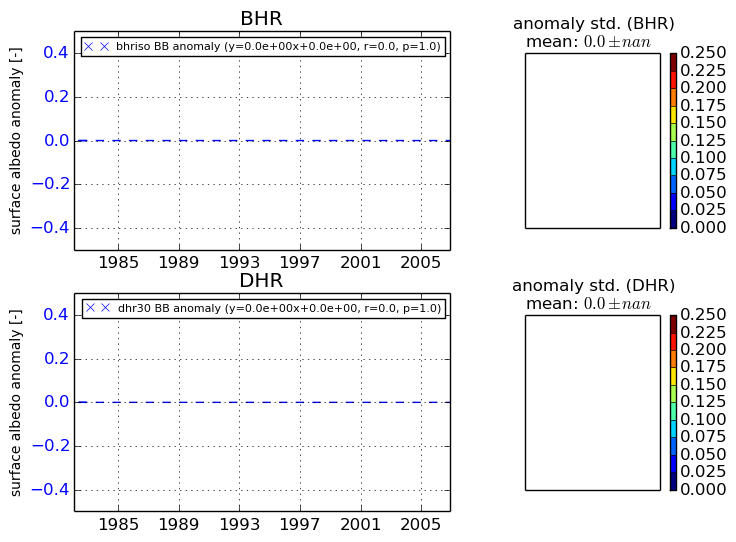
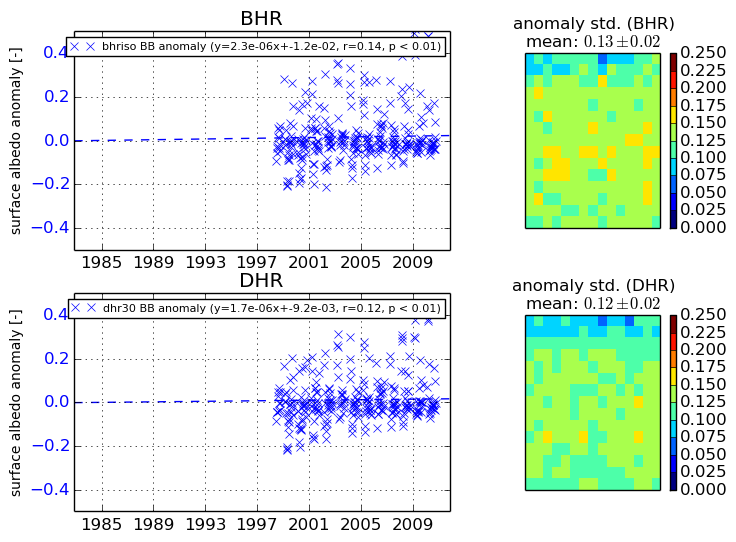
Temporal anomaly analyis

The variance of the temporal anomalies provides an additional measure about the stability of the signal AFTER removal of the mean seasonal cylce.
+000 deg


+057/+063 deg