BELMANIP_00408


Location

lon / lat [deg]: 107.3373 / 63.5995

Source network: BELMANIP


Geostationary surface albedo (GSA) data


“+000”


“+057/+063”


Landcover information (based on ESA CCI landcover data)


Landcover fractions @ 2km distance


Landcover fractions @ 20 km distance


Legend


Distance to open water bodies [km]:

21.67

Distance to urban areas [km]:

none in region


Radius: 1 km

Number of landcover classes:

1

Dominant landcover type:

80: Tree cover, needleleaved, deciduous, closed to open (>15%)

Fraction of dominant landcover type [%]:

100.0


Radius: 2 km

Number of landcover classes:

1

Dominant landcover type:

80: Tree cover, needleleaved, deciduous, closed to open (>15%)

Fraction of dominant landcover type [%]:

100.0


Radius: 5 km

Number of landcover classes:

1

Dominant landcover type:

80: Tree cover, needleleaved, deciduous, closed to open (>15%)

Fraction of dominant landcover type [%]:

100.0


Radius: 10 km

Number of landcover classes:

1

Dominant landcover type:

80: Tree cover, needleleaved, deciduous, closed to open (>15%)

Fraction of dominant landcover type [%]:

99.0


Radius: 20 km

Number of landcover classes:

2

Dominant landcover type:

80: Tree cover, needleleaved, deciduous, closed to open (>15%)

Fraction of dominant landcover type [%]:

98.0


Disturbances


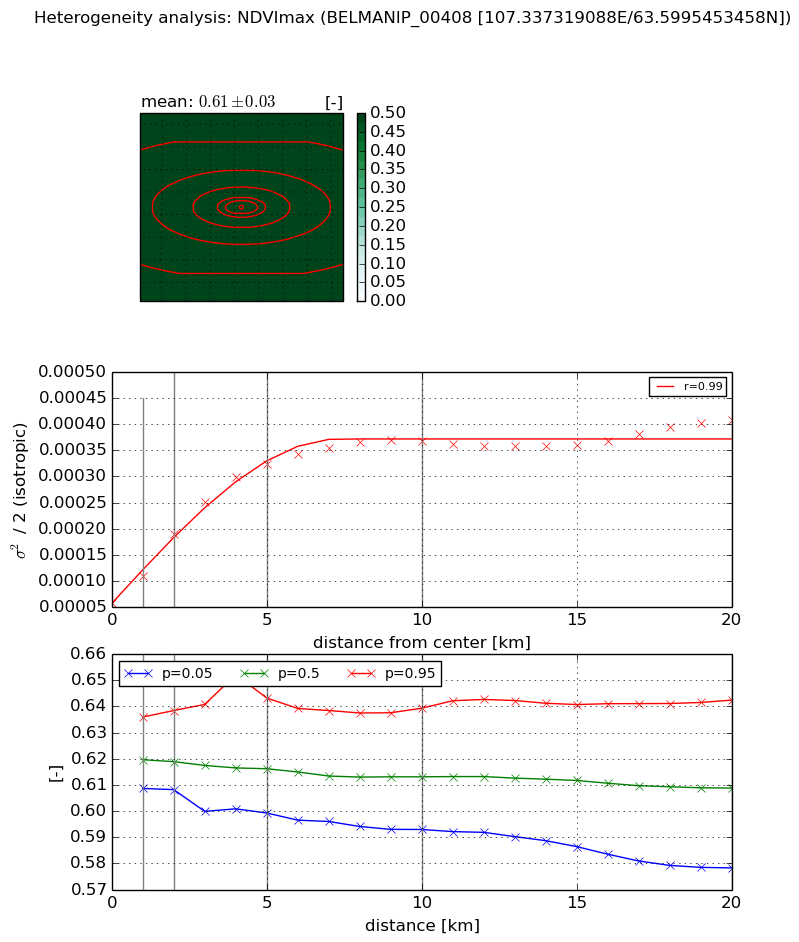
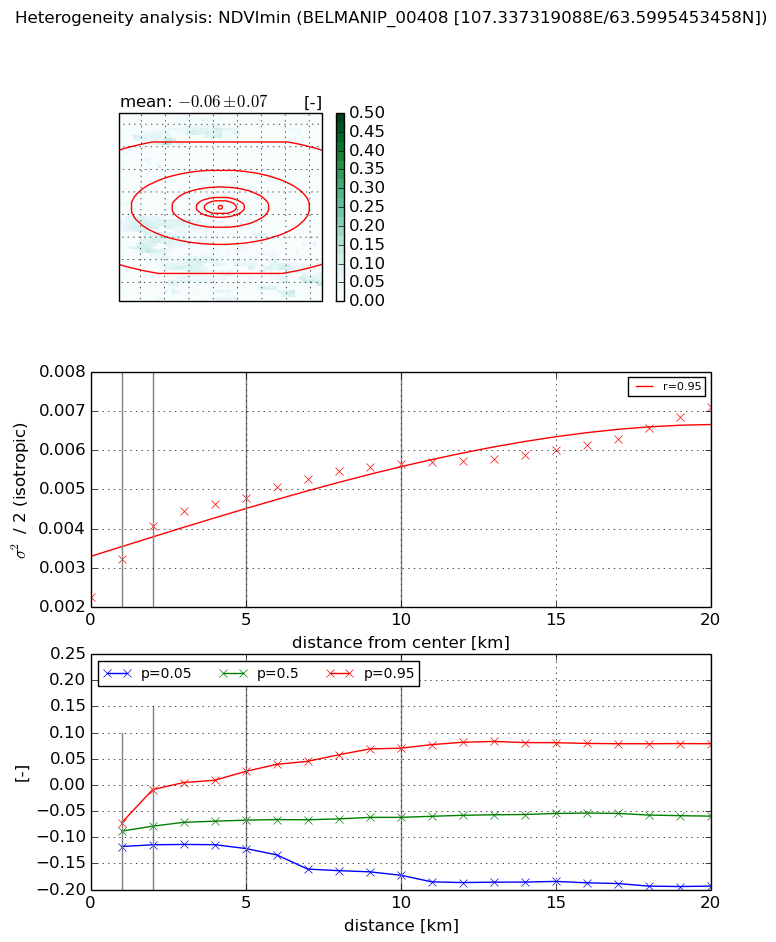
Heterogeneity analysis

The heterogeneity analysis provides information about the spatial and temporal heterogeneity of the site.

Topography


Roman et al. (2009) index


St

11.2409595854

Rcv

0.0379934003724

Rse

0.0

Rst

-0.00731066206835

Rsv

0.221577067877


Height range @ 1km [m]

55

Height range @ 2km [m]

71

Height range @ 5km [m]

98

Height range @ 10km [m]

-999

Height range @ 20km [m]

-999


Variance slope @ 1 km

251

Variance slope @ 2 km

265

Variance slope @ 5 km

181

Variance slope @ 10 km

-999

Variance slope @ 20 km

-999


NDVI (max. NDVI composite)


Roman et al. (2009) index


St

59.5764714681

Rcv

0.0217337206356

Rse

0.0

Rst

-0.00331007026855

Rsv

-0.0253116585892


NDVI range @ 1km [-]

0.03

NDVI range @ 2km [-]

0.03

NDVI range @ 5km [-]

0.04

NDVI range @ 10km [-]

0.05

NDVI range @ 20km [-]

0.06


Variance slope @ 1 km

5.30844535234e-05

Variance slope @ 2 km

6.59770825187e-05

Variance slope @ 5 km

5.61281280375e-05

Variance slope @ 10 km

3.06799812554e-05

Variance slope @ 20 km

1.2115499144e-05


NDVI (min. NDVI composite)I


Roman et al. (2009) index


St

0.706439872933

Rcv

0.62627357371

Rse

0.0

Rst

-0.287387691239

Rsv

3.33298464923


NDVI range @ 1km [-]

0.05

NDVI range @ 2km [-]

0.11

NDVI range @ 5km [-]

0.15

NDVI range @ 10km [-]

0.24

NDVI range @ 20km [-]

0.27


NDVI slope @ 1 km

0.000987094881553

NDVI slope @ 2 km

0.000912916859921

NDVI slope @ 5 km

0.000491736078008

NDVI slope @ 10 km

0.00029702751078

NDVI slope @ 20 km

0.00017504177839


Temporal stability analysis

+000 deg (BHR)


BHR statistics

Temporal stability [1/decade]:


abs

rel


Weighted least square:

None


Ordinary least square:

None


Probabilities that GCOS criteria is met:

Weighted least square:

None %

Ordinary least square:

None %


DHR statistics

Temporal stability [1/decade]:


abs

rel


Weighted least square:

None


Ordinary least square:

None


Probabilities that GCOS criteria is met:

Weighted least square:

None %

Ordinary least square:

None %


+057/+063 deg (BHR)


BHR statistics

Temporal stability [1/decade]:


abs

rel


Weighted least square:

-99999.0


Ordinary least square:

-99999.0


Probabilities that GCOS criteria is met:

Weighted least square:

-99999.0 %

Ordinary least square:

-99999.0 %


DHR statistics

Temporal stability [1/decade]:


abs

rel


Weighted least square:

-99999.0


Ordinary least square:

-99999.0


Probabilities that GCOS criteria is met:

Weighted least square:

-99999.0 %

Ordinary least square:

-99999.0 %


Temporal anomaly analyis

The variance of the temporal anomalies provides an additional measure about the stability of the signal AFTER removal of the mean seasonal cylce.

+000 deg


+057/+063 deg