BELMANIP_00409


Location

lon / lat [deg]: 120.3425 / 68.4112

Source network: BELMANIP


Geostationary surface albedo (GSA) data


“+000”


“+057/+063”


Landcover information (based on ESA CCI landcover data)


Landcover fractions @ 2km distance


Landcover fractions @ 20 km distance


Legend


Distance to open water bodies [km]:

22.52

Distance to urban areas [km]:

none in region


Radius: 1 km

Number of landcover classes:

1

Dominant landcover type:

80: Tree cover, needleleaved, deciduous, closed to open (>15%)

Fraction of dominant landcover type [%]:

100.0


Radius: 2 km

Number of landcover classes:

1

Dominant landcover type:

80: Tree cover, needleleaved, deciduous, closed to open (>15%)

Fraction of dominant landcover type [%]:

100.0


Radius: 5 km

Number of landcover classes:

1

Dominant landcover type:

80: Tree cover, needleleaved, deciduous, closed to open (>15%)

Fraction of dominant landcover type [%]:

99.0


Radius: 10 km

Number of landcover classes:

2

Dominant landcover type:

80: Tree cover, needleleaved, deciduous, closed to open (>15%)

Fraction of dominant landcover type [%]:

98.0


Radius: 20 km

Number of landcover classes:

2

Dominant landcover type:

80: Tree cover, needleleaved, deciduous, closed to open (>15%)

Fraction of dominant landcover type [%]:

98.0


Disturbances


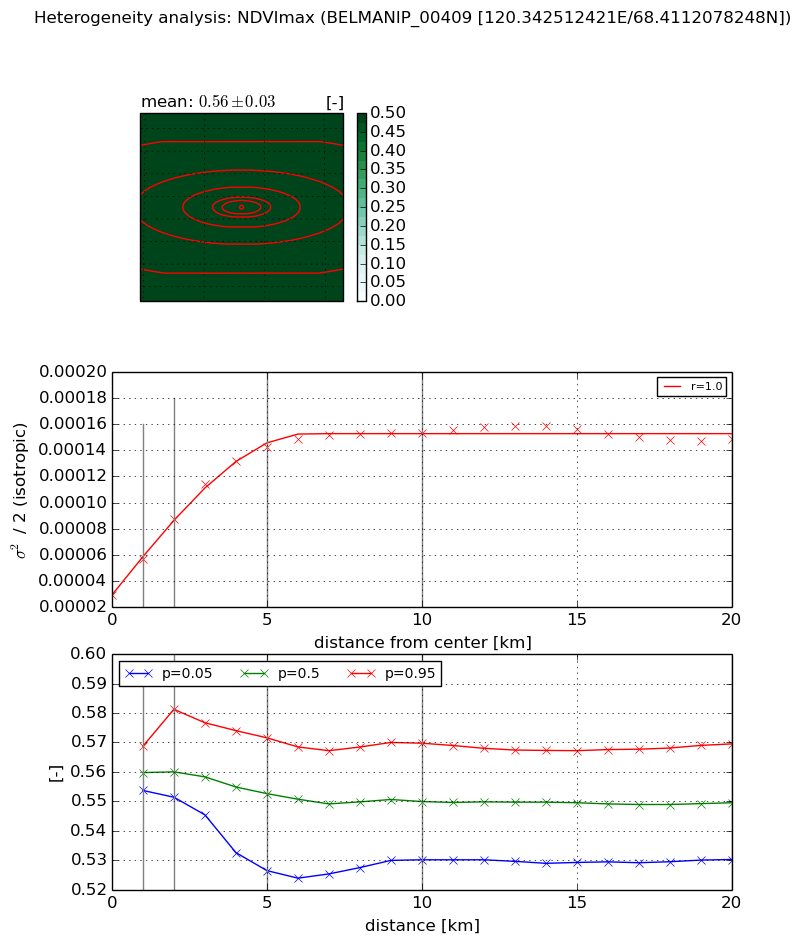
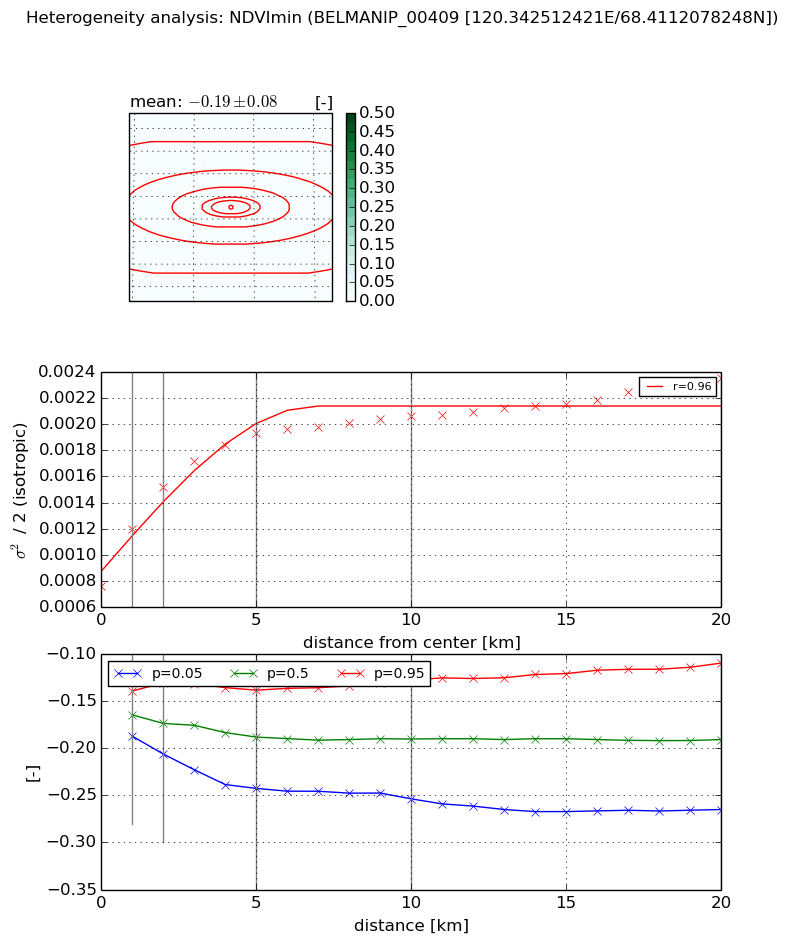
Heterogeneity analysis

The heterogeneity analysis provides information about the spatial and temporal heterogeneity of the site.

Topography


Roman et al. (2009) index


St

3.58199153876

Rcv

0.289294515495

Rse

0.0

Rst

0.28169614379

Rsv

0.266532257098


Height range @ 1km [m]

40

Height range @ 2km [m]

56

Height range @ 5km [m]

75

Height range @ 10km [m]

-999

Height range @ 20km [m]

-999


Variance slope @ 1 km

157

Variance slope @ 2 km

133

Variance slope @ 5 km

101

Variance slope @ 10 km

-999

Variance slope @ 20 km

-999


NDVI (max. NDVI composite)


Roman et al. (2009) index


St

2.70143000864e-07

Rcv

0.40158666998

Rse

0.0

Rst

0.16400859169

Rsv

11105228.8514


NDVI range @ 1km [-]

0.02

NDVI range @ 2km [-]

0.03

NDVI range @ 5km [-]

0.05

NDVI range @ 10km [-]

0.04

NDVI range @ 20km [-]

0.04


Variance slope @ 1 km

2.74276449539e-05

Variance slope @ 2 km

2.89343567243e-05

Variance slope @ 5 km

2.33680211369e-05

Variance slope @ 10 km

1.17517121763e-05

Variance slope @ 20 km

3.90623188233e-06


NDVI (min. NDVI composite)I


Roman et al. (2009) index


St

9.79728254949e-09

Rcv

-0.030947426083

Rse

0.0

Rst

0.0871314909038

Rsv

306207357.365


NDVI range @ 1km [-]

0.05

NDVI range @ 2km [-]

0.08

NDVI range @ 5km [-]

0.1

NDVI range @ 10km [-]

0.13

NDVI range @ 20km [-]

0.16


NDVI slope @ 1 km

0.000437079425846

NDVI slope @ 2 km

0.000378550962649

NDVI slope @ 5 km

0.000227736701403

NDVI slope @ 10 km

0.000109196569447

NDVI slope @ 20 km

5.24297720246e-05


Temporal stability analysis

+000 deg (BHR)


BHR statistics

Temporal stability [1/decade]:


abs

rel


Weighted least square:

None


Ordinary least square:

None


Probabilities that GCOS criteria is met:

Weighted least square:

None %

Ordinary least square:

None %


DHR statistics

Temporal stability [1/decade]:


abs

rel


Weighted least square:

None


Ordinary least square:

None


Probabilities that GCOS criteria is met:

Weighted least square:

None %

Ordinary least square:

None %


+057/+063 deg (BHR)


BHR statistics

Temporal stability [1/decade]:


abs

rel


Weighted least square:

-99999.0


Ordinary least square:

-99999.0


Probabilities that GCOS criteria is met:

Weighted least square:

-99999.0 %

Ordinary least square:

-99999.0 %


DHR statistics

Temporal stability [1/decade]:


abs

rel


Weighted least square:

-99999.0


Ordinary least square:

-99999.0


Probabilities that GCOS criteria is met:

Weighted least square:

-99999.0 %

Ordinary least square:

-99999.0 %


Temporal anomaly analyis

The variance of the temporal anomalies provides an additional measure about the stability of the signal AFTER removal of the mean seasonal cylce.

+000 deg


+057/+063 deg