BELMANIP_00415


Location

lon / lat [deg]: 75.5805 / 67.5562

Source network: BELMANIP


Geostationary surface albedo (GSA) data


“+000”


“+057/+063”


Landcover information (based on ESA CCI landcover data)


Landcover fractions @ 2km distance


Landcover fractions @ 20 km distance


Legend


Distance to open water bodies [km]:

1.59

Distance to urban areas [km]:

24.91


Radius: 1 km

Number of landcover classes:

1

Dominant landcover type:

150: Sparse vegetation (tree, shrub, herbaceous cover) (<15%)

Fraction of dominant landcover type [%]:

100.0


Radius: 2 km

Number of landcover classes:

1

Dominant landcover type:

150: Sparse vegetation (tree, shrub, herbaceous cover) (<15%)

Fraction of dominant landcover type [%]:

98.0


Radius: 5 km

Number of landcover classes:

2

Dominant landcover type:

150: Sparse vegetation (tree, shrub, herbaceous cover) (<15%)

Fraction of dominant landcover type [%]:

98.0


Radius: 10 km

Number of landcover classes:

3

Dominant landcover type:

150: Sparse vegetation (tree, shrub, herbaceous cover) (<15%)

Fraction of dominant landcover type [%]:

98.0


Radius: 20 km

Number of landcover classes:

3

Dominant landcover type:

150: Sparse vegetation (tree, shrub, herbaceous cover) (<15%)

Fraction of dominant landcover type [%]:

96.0


Disturbances


Heterogeneity analysis

The heterogeneity analysis provides information about the spatial and temporal heterogeneity of the site.

Topography


Roman et al. (2009) index


St

5.36875827781

Rcv

0.271087720236

Rse

0.0

Rst

0.0684825988595

Rsv

0.219218109208


Height range @ 1km [m]

14

Height range @ 2km [m]

11

Height range @ 5km [m]

23

Height range @ 10km [m]

-999

Height range @ 20km [m]

-999


Variance slope @ 1 km

10

Variance slope @ 2 km

10

Variance slope @ 5 km

8

Variance slope @ 10 km

-999

Variance slope @ 20 km

-999


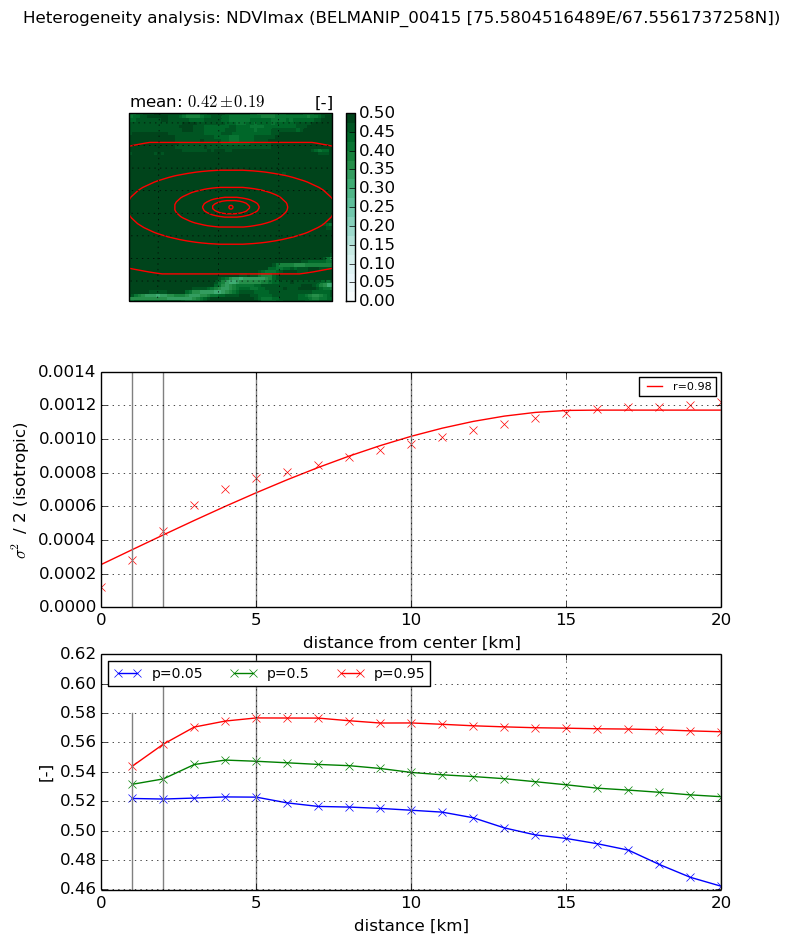
NDVI (max. NDVI composite)


Roman et al. (2009) index


St

2.89244072046

Rcv

0.133111677575

Rse

0.0

Rst

-0.0487239910291

Rsv

0.855350669833


NDVI range @ 1km [-]

0.02

NDVI range @ 2km [-]

0.04

NDVI range @ 5km [-]

0.05

NDVI range @ 10km [-]

0.06

NDVI range @ 20km [-]

0.11


Variance slope @ 1 km

0.000161561594252

Variance slope @ 2 km

0.000168606155551

Variance slope @ 5 km

0.00013351421377

Variance slope @ 10 km

7.9718613151e-05

Variance slope @ 20 km

4.73856131732e-05


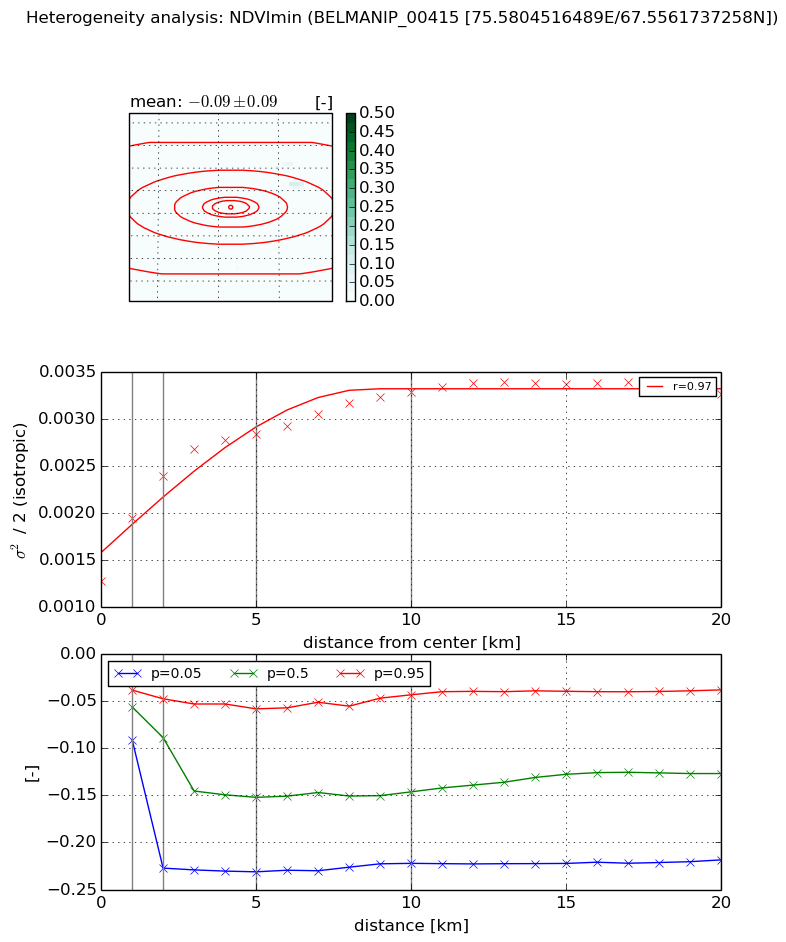
NDVI (min. NDVI composite)I


Roman et al. (2009) index


St

3.69412508435

Rcv

-0.114195892947

Rse

0.0

Rst

-0.151692215209

Rsv

0.546212167687


NDVI range @ 1km [-]

0.05

NDVI range @ 2km [-]

0.18

NDVI range @ 5km [-]

0.17

NDVI range @ 10km [-]

0.18

NDVI range @ 20km [-]

0.18


NDVI slope @ 1 km

0.000669925800287

NDVI slope @ 2 km

0.000560440758381

NDVI slope @ 5 km

0.000302138440482

NDVI slope @ 10 km

0.000167226430517

NDVI slope @ 20 km

7.07711405163e-05


Temporal stability analysis

+000 deg (BHR)


BHR statistics

Temporal stability [1/decade]:


abs

rel


Weighted least square:

None


Ordinary least square:

None


Probabilities that GCOS criteria is met:

Weighted least square:

None %

Ordinary least square:

None %


DHR statistics

Temporal stability [1/decade]:


abs

rel


Weighted least square:

None


Ordinary least square:

None


Probabilities that GCOS criteria is met:

Weighted least square:

None %

Ordinary least square:

None %


+057/+063 deg (BHR)


BHR statistics

Temporal stability [1/decade]:


abs

rel


Weighted least square:

-99999.0


Ordinary least square:

-99999.0


Probabilities that GCOS criteria is met:

Weighted least square:

-99999.0 %

Ordinary least square:

-99999.0 %


DHR statistics

Temporal stability [1/decade]:


abs

rel


Weighted least square:

-99999.0


Ordinary least square:

-99999.0


Probabilities that GCOS criteria is met:

Weighted least square:

-99999.0 %

Ordinary least square:

-99999.0 %


Temporal anomaly analyis

The variance of the temporal anomalies provides an additional measure about the stability of the signal AFTER removal of the mean seasonal cylce.

+000 deg


+057/+063 deg