BELMANIP_00416


Location

lon / lat [deg]: 101.7925 / 69.1656

Source network: BELMANIP


Geostationary surface albedo (GSA) data


“+000”


“+057/+063”


Landcover information (based on ESA CCI landcover data)


Landcover fractions @ 2km distance


Landcover fractions @ 20 km distance


Legend


Distance to open water bodies [km]:

6.2

Distance to urban areas [km]:

none in region


Radius: 1 km

Number of landcover classes:

1

Dominant landcover type:

150: Sparse vegetation (tree, shrub, herbaceous cover) (<15%)

Fraction of dominant landcover type [%]:

100.0


Radius: 2 km

Number of landcover classes:

1

Dominant landcover type:

150: Sparse vegetation (tree, shrub, herbaceous cover) (<15%)

Fraction of dominant landcover type [%]:

99.0


Radius: 5 km

Number of landcover classes:

2

Dominant landcover type:

150: Sparse vegetation (tree, shrub, herbaceous cover) (<15%)

Fraction of dominant landcover type [%]:

98.0


Radius: 10 km

Number of landcover classes:

1

Dominant landcover type:

150: Sparse vegetation (tree, shrub, herbaceous cover) (<15%)

Fraction of dominant landcover type [%]:

98.0


Radius: 20 km

Number of landcover classes:

2

Dominant landcover type:

150: Sparse vegetation (tree, shrub, herbaceous cover) (<15%)

Fraction of dominant landcover type [%]:

97.0


Disturbances


Heterogeneity analysis

The heterogeneity analysis provides information about the spatial and temporal heterogeneity of the site.

Topography


Roman et al. (2009) index


St

5.87045533748

Rcv

0.337006117498

Rse

0.0

Rst

0.0390428035027

Rsv

-0.134984691817


Height range @ 1km [m]

21

Height range @ 2km [m]

53

Height range @ 5km [m]

97

Height range @ 10km [m]

-999

Height range @ 20km [m]

-999


Variance slope @ 1 km

235

Variance slope @ 2 km

261

Variance slope @ 5 km

172

Variance slope @ 10 km

-999

Variance slope @ 20 km

-999


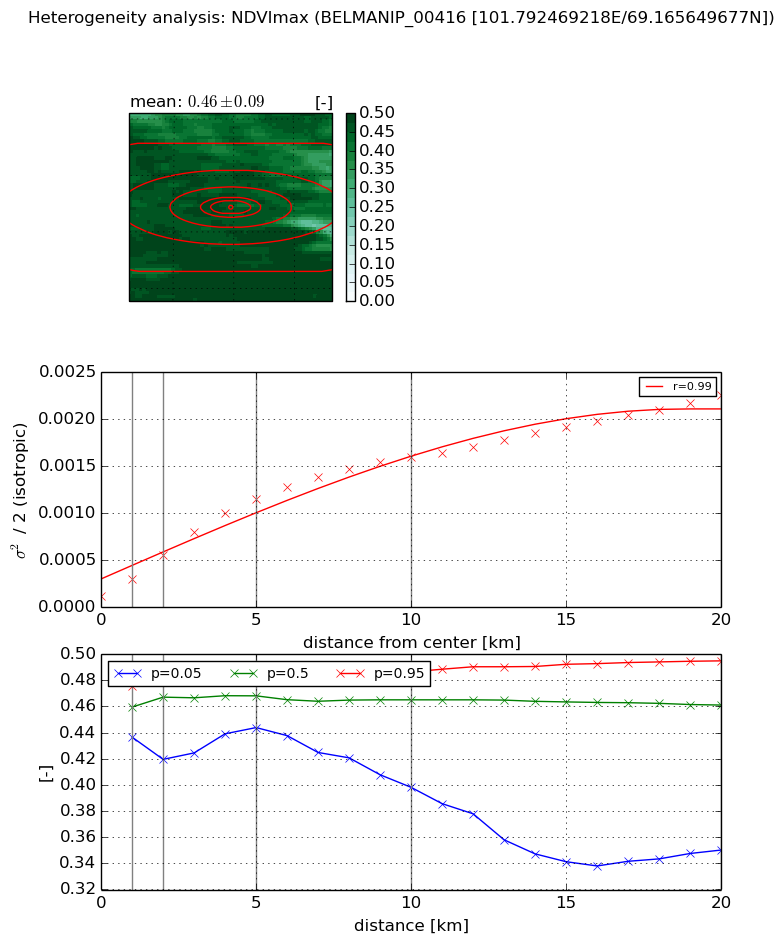
NDVI (max. NDVI composite)


Roman et al. (2009) index


St

4.44022068906

Rcv

-0.241298616648

Rse

0.0

Rst

0.111365089026

Rsv

-0.322978387385


NDVI range @ 1km [-]

0.04

NDVI range @ 2km [-]

0.06

NDVI range @ 5km [-]

0.04

NDVI range @ 10km [-]

0.09

NDVI range @ 20km [-]

0.14


Variance slope @ 1 km

0.00018300451276

Variance slope @ 2 km

0.000215290500376

Variance slope @ 5 km

0.000213295025718

Variance slope @ 10 km

0.000150078047533

Variance slope @ 20 km

9.47913286631e-05


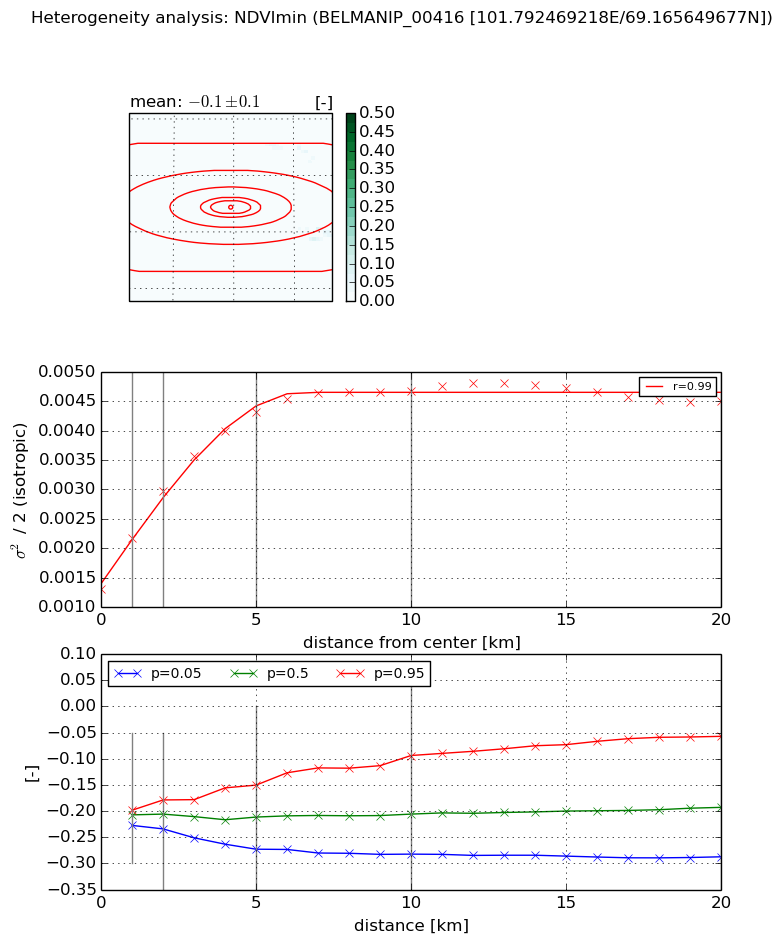
NDVI (min. NDVI composite)I


Roman et al. (2009) index


St

1.57658045332

Rcv

0.471221633477

Rse

0.0

Rst

-0.159341520734

Rsv

1.2722893096


NDVI range @ 1km [-]

0.03

NDVI range @ 2km [-]

0.06

NDVI range @ 5km [-]

0.12

NDVI range @ 10km [-]

0.19

NDVI range @ 20km [-]

0.23


NDVI slope @ 1 km

0.000871848283622

NDVI slope @ 2 km

0.000829418386509

NDVI slope @ 5 km

0.000602133150871

NDVI slope @ 10 km

0.000313437967616

NDVI slope @ 20 km

0.000104087765769


Temporal stability analysis

+000 deg (BHR)


BHR statistics

Temporal stability [1/decade]:


abs

rel


Weighted least square:

None


Ordinary least square:

None


Probabilities that GCOS criteria is met:

Weighted least square:

None %

Ordinary least square:

None %


DHR statistics

Temporal stability [1/decade]:


abs

rel


Weighted least square:

None


Ordinary least square:

None


Probabilities that GCOS criteria is met:

Weighted least square:

None %

Ordinary least square:

None %


+057/+063 deg (BHR)


BHR statistics

Temporal stability [1/decade]:


abs

rel


Weighted least square:

-99999.0


Ordinary least square:

-99999.0


Probabilities that GCOS criteria is met:

Weighted least square:

-99999.0 %

Ordinary least square:

-99999.0 %


DHR statistics

Temporal stability [1/decade]:


abs

rel


Weighted least square:

-99999.0


Ordinary least square:

-99999.0


Probabilities that GCOS criteria is met:

Weighted least square:

-99999.0 %

Ordinary least square:

-99999.0 %


Temporal anomaly analyis

The variance of the temporal anomalies provides an additional measure about the stability of the signal AFTER removal of the mean seasonal cylce.

+000 deg


+057/+063 deg