BELMANIP_00418


Location

lon / lat [deg]: 68.2209 / 61.068

Source network: BELMANIP


Geostationary surface albedo (GSA) data


“+000”


“+057/+063”


Landcover information (based on ESA CCI landcover data)


Landcover fractions @ 2km distance


Landcover fractions @ 20 km distance


Legend


Distance to open water bodies [km]:

3.24

Distance to urban areas [km]:

13.64


Radius: 1 km

Number of landcover classes:

1

Dominant landcover type:

180: shrub or herbaceous cover, flooded, fresh/saline/brakish water

Fraction of dominant landcover type [%]:

100.0


Radius: 2 km

Number of landcover classes:

1

Dominant landcover type:

180: shrub or herbaceous cover, flooded, fresh/saline/brakish water

Fraction of dominant landcover type [%]:

100.0


Radius: 5 km

Number of landcover classes:

2

Dominant landcover type:

180: shrub or herbaceous cover, flooded, fresh/saline/brakish water

Fraction of dominant landcover type [%]:

97.0


Radius: 10 km

Number of landcover classes:

5

Dominant landcover type:

180: shrub or herbaceous cover, flooded, fresh/saline/brakish water

Fraction of dominant landcover type [%]:

89.0


Radius: 20 km

Number of landcover classes:

5

Dominant landcover type:

180: shrub or herbaceous cover, flooded, fresh/saline/brakish water

Fraction of dominant landcover type [%]:

64.0


Disturbances


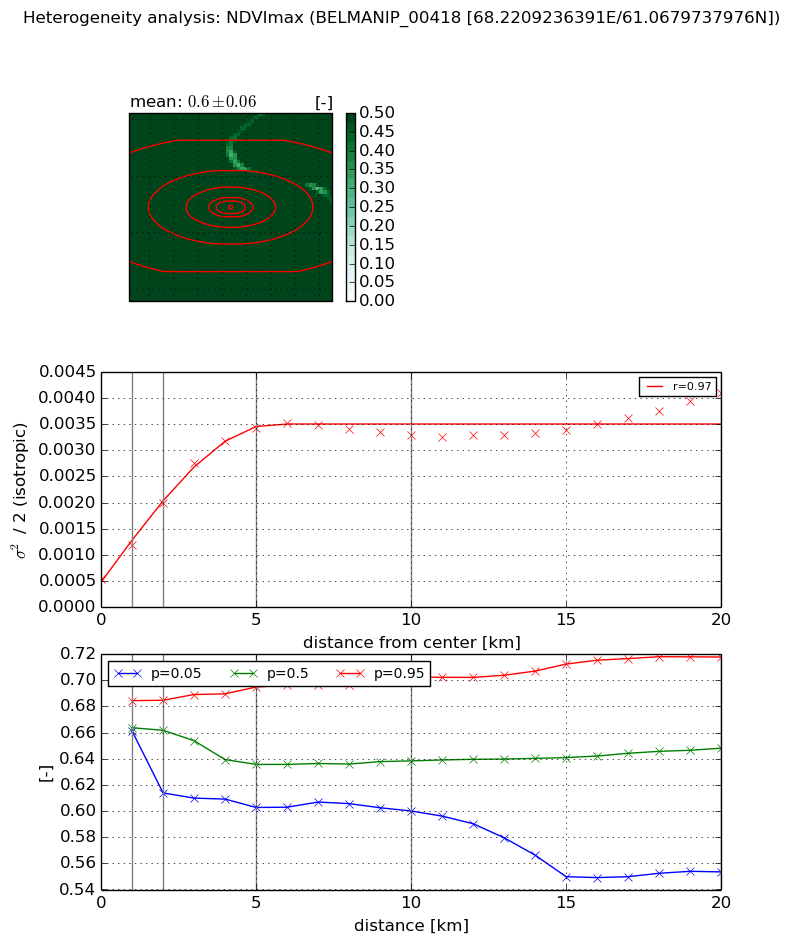
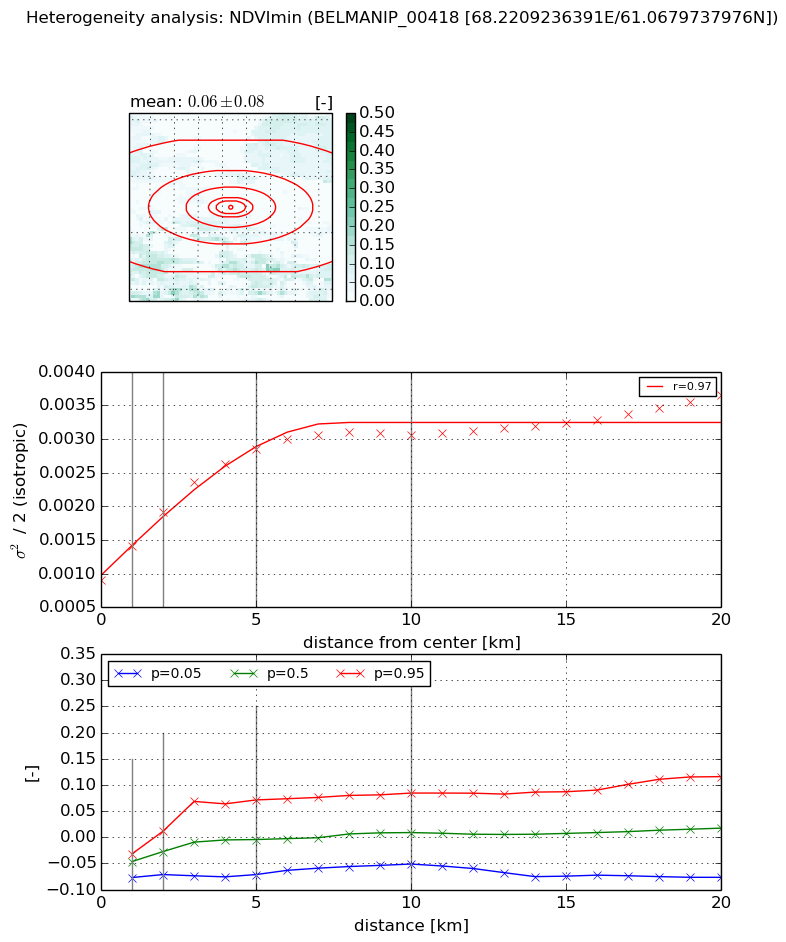
Heterogeneity analysis

The heterogeneity analysis provides information about the spatial and temporal heterogeneity of the site.

Topography


Roman et al. (2009) index


St

1.81137964651

Rcv

0.700391033588

Rse

0.0

Rst

-1.92141285947e-07

Rsv

-0.955804926072


Height range @ 1km [m]

1

Height range @ 2km [m]

2

Height range @ 5km [m]

6

Height range @ 10km [m]

-999

Height range @ 20km [m]

-999


Variance slope @ 1 km

0

Variance slope @ 2 km

0

Variance slope @ 5 km

0

Variance slope @ 10 km

-999

Variance slope @ 20 km

-999


NDVI (max. NDVI composite)


Roman et al. (2009) index


St

3.12369840624

Rcv

0.0532727946187

Rse

0.0

Rst

-0.15334638678

Rsv

0.753780834815


NDVI range @ 1km [-]

0.02

NDVI range @ 2km [-]

0.07

NDVI range @ 5km [-]

0.09

NDVI range @ 10km [-]

0.1

NDVI range @ 20km [-]

0.16


Variance slope @ 1 km

0.000642323830878

Variance slope @ 2 km

0.000726527041973

Variance slope @ 5 km

0.000603971339498

Variance slope @ 10 km

0.000258343511499

Variance slope @ 20 km

0.000104527575227


NDVI (min. NDVI composite)I


Roman et al. (2009) index


St

1.89171918186e-07

Rcv

1.18522117378

Rse

0.0

Rst

0.0302508456074

Rsv

15858589.3659


NDVI range @ 1km [-]

0.05

NDVI range @ 2km [-]

0.08

NDVI range @ 5km [-]

0.14

NDVI range @ 10km [-]

0.14

NDVI range @ 20km [-]

0.19


NDVI slope @ 1 km

0.000501661008696

NDVI slope @ 2 km

0.000507943312879

NDVI slope @ 5 km

0.000397256623456

NDVI slope @ 10 km

0.000208253248683

NDVI slope @ 20 km

9.5034754719e-05


Temporal stability analysis

+000 deg (BHR)


BHR statistics

Temporal stability [1/decade]:


abs

rel


Weighted least square:

-99999.0


Ordinary least square:

-99999.0


Probabilities that GCOS criteria is met:

Weighted least square:

-99999.0 %

Ordinary least square:

-99999.0 %


DHR statistics

Temporal stability [1/decade]:


abs

rel


Weighted least square:

-99999.0


Ordinary least square:

-99999.0


Probabilities that GCOS criteria is met:

Weighted least square:

-99999.0 %

Ordinary least square:

-99999.0 %


+057/+063 deg (BHR)


BHR statistics

Temporal stability [1/decade]:


abs

rel


Weighted least square:

-99999.0


Ordinary least square:

-99999.0


Probabilities that GCOS criteria is met:

Weighted least square:

-99999.0 %

Ordinary least square:

-99999.0 %


DHR statistics

Temporal stability [1/decade]:


abs

rel


Weighted least square:

-99999.0


Ordinary least square:

-99999.0


Probabilities that GCOS criteria is met:

Weighted least square:

-99999.0 %

Ordinary least square:

-99999.0 %


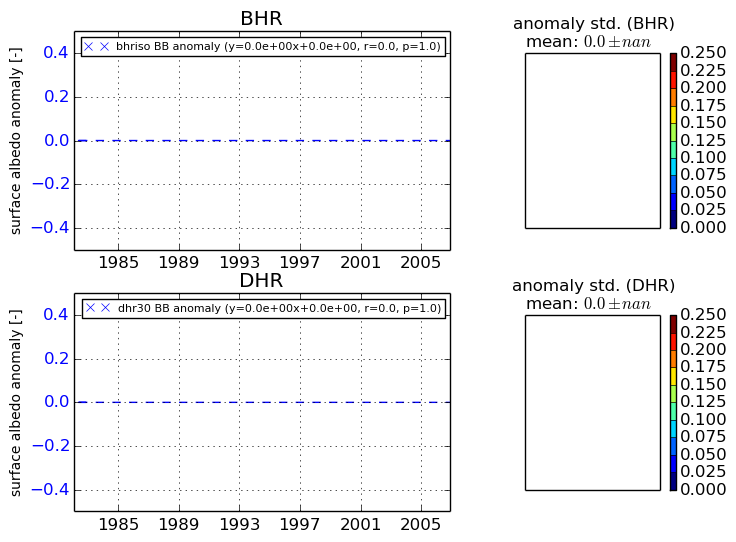
Temporal anomaly analyis

The variance of the temporal anomalies provides an additional measure about the stability of the signal AFTER removal of the mean seasonal cylce.
+000 deg


+057/+063 deg