BELMANIP_00419


Location

lon / lat [deg]: 75.5805 / 61.1015

Source network: BELMANIP


Geostationary surface albedo (GSA) data


“+000”


“+057/+063”


Landcover information (based on ESA CCI landcover data)


Landcover fractions @ 2km distance


Landcover fractions @ 20 km distance


Legend


Distance to open water bodies [km]:

0.07

Distance to urban areas [km]:

11.5


Radius: 1 km

Number of landcover classes:

2

Dominant landcover type:

180: shrub or herbaceous cover, flooded, fresh/saline/brakish water

Fraction of dominant landcover type [%]:

66.0


Radius: 2 km

Number of landcover classes:

2

Dominant landcover type:

180: shrub or herbaceous cover, flooded, fresh/saline/brakish water

Fraction of dominant landcover type [%]:

71.0


Radius: 5 km

Number of landcover classes:

3

Dominant landcover type:

180: shrub or herbaceous cover, flooded, fresh/saline/brakish water

Fraction of dominant landcover type [%]:

80.0


Radius: 10 km

Number of landcover classes:

5

Dominant landcover type:

180: shrub or herbaceous cover, flooded, fresh/saline/brakish water

Fraction of dominant landcover type [%]:

73.0


Radius: 20 km

Number of landcover classes:

5

Dominant landcover type:

180: shrub or herbaceous cover, flooded, fresh/saline/brakish water

Fraction of dominant landcover type [%]:

66.0


Disturbances


Heterogeneity analysis

The heterogeneity analysis provides information about the spatial and temporal heterogeneity of the site.

Topography


Roman et al. (2009) index


St

13.311919871

Rcv

0.0951330159113

Rse

0.0

Rst

-0.036051297666

Rsv

0.0941776198682


Height range @ 1km [m]

3

Height range @ 2km [m]

5

Height range @ 5km [m]

7

Height range @ 10km [m]

-999

Height range @ 20km [m]

-999


Variance slope @ 1 km

4

Variance slope @ 2 km

3

Variance slope @ 5 km

1

Variance slope @ 10 km

-999

Variance slope @ 20 km

-999


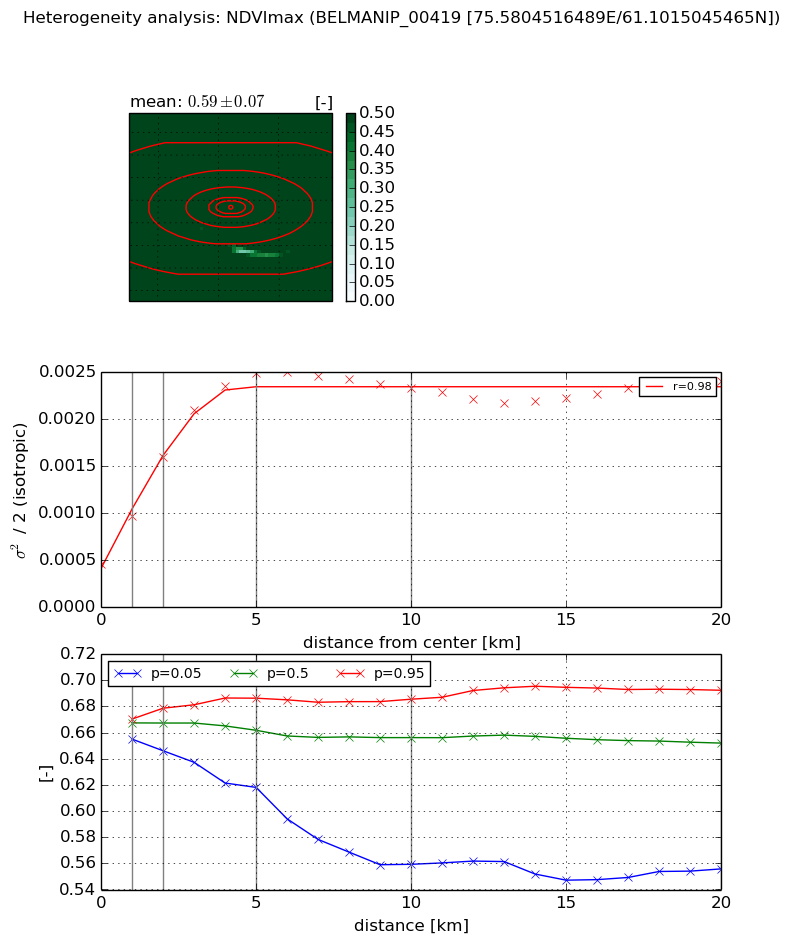
NDVI (max. NDVI composite)


Roman et al. (2009) index


St

9.37220379253e-08

Rcv

0.635675583187

Rse

0.0

Rst

0.154864534133

Rsv

32009546.4452


NDVI range @ 1km [-]

0.02

NDVI range @ 2km [-]

0.03

NDVI range @ 5km [-]

0.07

NDVI range @ 10km [-]

0.13

NDVI range @ 20km [-]

0.14


Variance slope @ 1 km

0.000513099638925

Variance slope @ 2 km

0.000567348407604

Variance slope @ 5 km

0.000421923943739

Variance slope @ 10 km

0.000166424964465

Variance slope @ 20 km

4.64550224087e-05


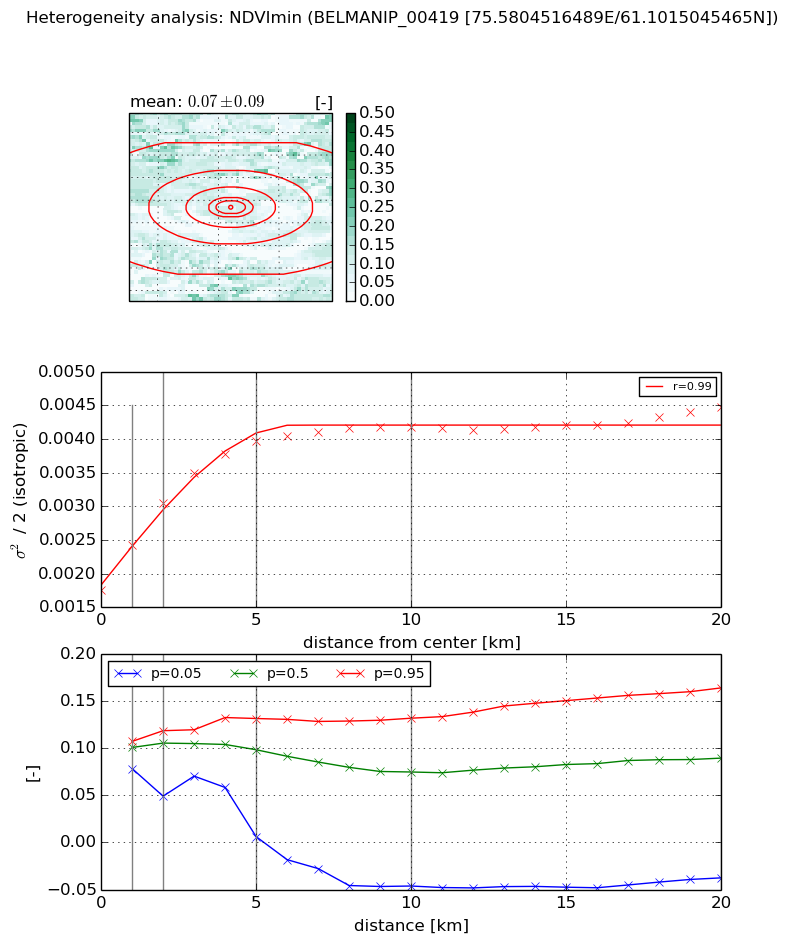
NDVI (min. NDVI composite)I


Roman et al. (2009) index


St

1.09647485277

Rcv

1.29218577441

Rse

0.0

Rst

-0.443855086392

Rsv

-0.999999999989


NDVI range @ 1km [-]

0.03

NDVI range @ 2km [-]

0.07

NDVI range @ 5km [-]

0.13

NDVI range @ 10km [-]

0.18

NDVI range @ 20km [-]

0.2


NDVI slope @ 1 km

0.000680698672054

NDVI slope @ 2 km

0.000651206730856

NDVI slope @ 5 km

0.000445369666192

NDVI slope @ 10 km

0.000218313399039

NDVI slope @ 20 km

8.41797465684e-05


Temporal stability analysis

+000 deg (BHR)


BHR statistics

Temporal stability [1/decade]:


abs

rel


Weighted least square:

None


Ordinary least square:

None


Probabilities that GCOS criteria is met:

Weighted least square:

None %

Ordinary least square:

None %


DHR statistics

Temporal stability [1/decade]:


abs

rel


Weighted least square:

None


Ordinary least square:

None


Probabilities that GCOS criteria is met:

Weighted least square:

None %

Ordinary least square:

None %


+057/+063 deg (BHR)


BHR statistics

Temporal stability [1/decade]:


abs

rel


Weighted least square:

-99999.0


Ordinary least square:

-99999.0


Probabilities that GCOS criteria is met:

Weighted least square:

-99999.0 %

Ordinary least square:

-99999.0 %


DHR statistics

Temporal stability [1/decade]:


abs

rel


Weighted least square:

-99999.0


Ordinary least square:

-99999.0


Probabilities that GCOS criteria is met:

Weighted least square:

-99999.0 %

Ordinary least square:

-99999.0 %


Temporal anomaly analyis

The variance of the temporal anomalies provides an additional measure about the stability of the signal AFTER removal of the mean seasonal cylce.

+000 deg


+057/+063 deg