BELMANIP_00420


Location

lon / lat [deg]: 95.2395 / 69.1321

Source network: BELMANIP


Geostationary surface albedo (GSA) data


“+000”


“+057/+063”


Landcover information (based on ESA CCI landcover data)


Landcover fractions @ 2km distance


Landcover fractions @ 20 km distance


Legend


Distance to open water bodies [km]:

17.52

Distance to urban areas [km]:

none in region


Radius: 1 km

Number of landcover classes:

1

Dominant landcover type:

200: bare areas

Fraction of dominant landcover type [%]:

100.0


Radius: 2 km

Number of landcover classes:

1

Dominant landcover type:

200: bare areas

Fraction of dominant landcover type [%]:

100.0


Radius: 5 km

Number of landcover classes:

1

Dominant landcover type:

200: bare areas

Fraction of dominant landcover type [%]:

100.0


Radius: 10 km

Number of landcover classes:

2

Dominant landcover type:

200: bare areas

Fraction of dominant landcover type [%]:

98.0


Radius: 20 km

Number of landcover classes:

2

Dominant landcover type:

200: bare areas

Fraction of dominant landcover type [%]:

87.0


Disturbances


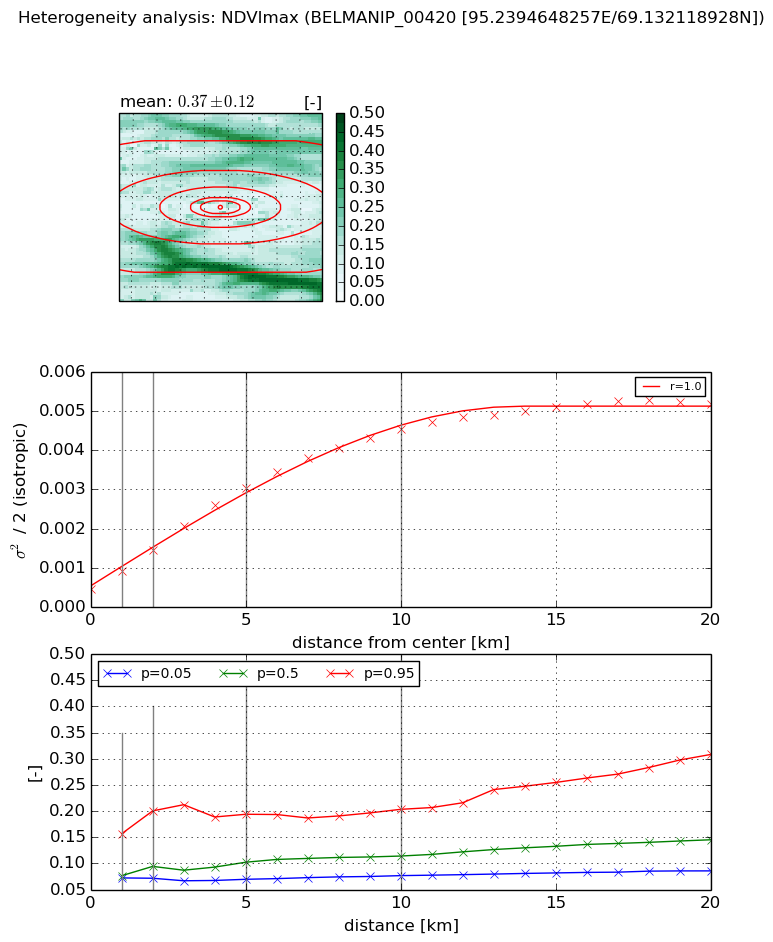
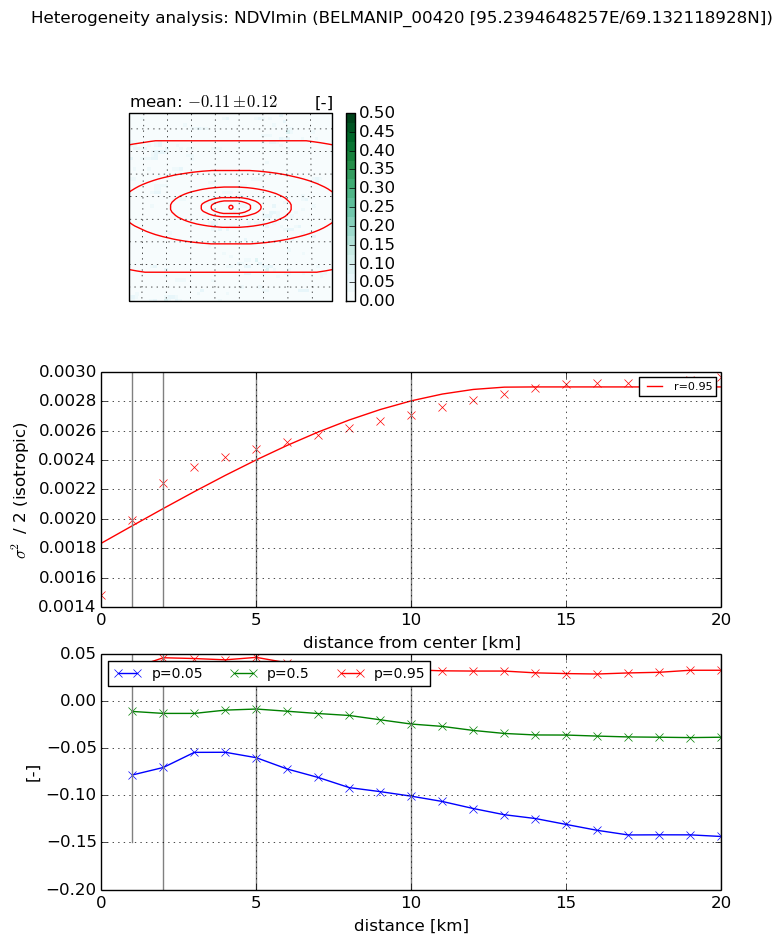
Heterogeneity analysis

The heterogeneity analysis provides information about the spatial and temporal heterogeneity of the site.

Topography


Roman et al. (2009) index


St

11.4884523659

Rcv

0.218344111582

Rse

0.0

Rst

-0.00513526907613

Rsv

-0.0376523979701


Height range @ 1km [m]

67

Height range @ 2km [m]

237

Height range @ 5km [m]

347

Height range @ 10km [m]

-999

Height range @ 20km [m]

-999


Variance slope @ 1 km

1992

Variance slope @ 2 km

2495

Variance slope @ 5 km

2510

Variance slope @ 10 km

-999

Variance slope @ 20 km

-999


NDVI (max. NDVI composite)


Roman et al. (2009) index


St

13.0714594406

Rcv

-0.175865911121

Rse

0.0

Rst

-0.0069576229906

Rsv

-0.0466841206104


NDVI range @ 1km [-]

0.08

NDVI range @ 2km [-]

0.13

NDVI range @ 5km [-]

0.12

NDVI range @ 10km [-]

0.13

NDVI range @ 20km [-]

0.22


Variance slope @ 1 km

0.000443482205131

Variance slope @ 2 km

0.000501286612507

Variance slope @ 5 km

0.000530965704664

Variance slope @ 10 km

0.000418856750832

Variance slope @ 20 km

0.000228424924437


NDVI (min. NDVI composite)I


Roman et al. (2009) index


St

nan

Rcv

nan

Rse

nan

Rst

nan

Rsv

nan


NDVI range @ 1km [-]

0.11

NDVI range @ 2km [-]

0.12

NDVI range @ 5km [-]

0.11

NDVI range @ 10km [-]

0.13

NDVI range @ 20km [-]

0.18


NDVI slope @ 1 km

0.00051391380324

NDVI slope @ 2 km

0.00038132999313

NDVI slope @ 5 km

0.00018111495603

NDVI slope @ 10 km

9.52344537301e-05

NDVI slope @ 20 km

5.30737010767e-05


Temporal stability analysis

+000 deg (BHR)


BHR statistics

Temporal stability [1/decade]:


abs

rel


Weighted least square:

None


Ordinary least square:

None


Probabilities that GCOS criteria is met:

Weighted least square:

None %

Ordinary least square:

None %


DHR statistics

Temporal stability [1/decade]:


abs

rel


Weighted least square:

None


Ordinary least square:

None


Probabilities that GCOS criteria is met:

Weighted least square:

None %

Ordinary least square:

None %


+057/+063 deg (BHR)


BHR statistics

Temporal stability [1/decade]:


abs

rel


Weighted least square:

-99999.0


Ordinary least square:

-99999.0


Probabilities that GCOS criteria is met:

Weighted least square:

-99999.0 %

Ordinary least square:

-99999.0 %


DHR statistics

Temporal stability [1/decade]:


abs

rel


Weighted least square:

-99999.0


Ordinary least square:

-99999.0


Probabilities that GCOS criteria is met:

Weighted least square:

-99999.0 %

Ordinary least square:

-99999.0 %


Temporal anomaly analyis

The variance of the temporal anomalies provides an additional measure about the stability of the signal AFTER removal of the mean seasonal cylce.

+000 deg


+057/+063 deg