BELMANIP_00421


Location

lon / lat [deg]: 6.711 / 32.6672

Source network: BELMANIP


Geostationary surface albedo (GSA) data


“+000”


“+057/+063”


Landcover information (based on ESA CCI landcover data)


Landcover fractions @ 2km distance


Landcover fractions @ 20 km distance


Legend


Distance to open water bodies [km]:

none in region

Distance to urban areas [km]:

none in region


Radius: 1 km

Number of landcover classes:

1

Dominant landcover type:

200: bare areas

Fraction of dominant landcover type [%]:

100.0


Radius: 2 km

Number of landcover classes:

1

Dominant landcover type:

200: bare areas

Fraction of dominant landcover type [%]:

100.0


Radius: 5 km

Number of landcover classes:

1

Dominant landcover type:

200: bare areas

Fraction of dominant landcover type [%]:

100.0


Radius: 10 km

Number of landcover classes:

1

Dominant landcover type:

200: bare areas

Fraction of dominant landcover type [%]:

100.0


Radius: 20 km

Number of landcover classes:

1

Dominant landcover type:

200: bare areas

Fraction of dominant landcover type [%]:

100.0


Disturbances


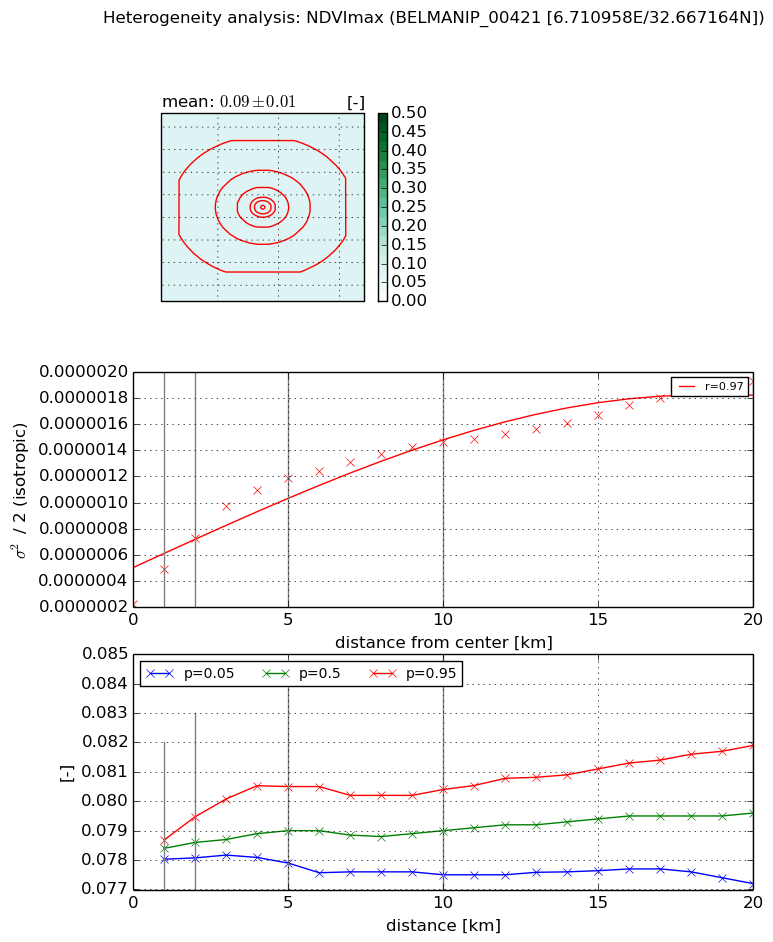
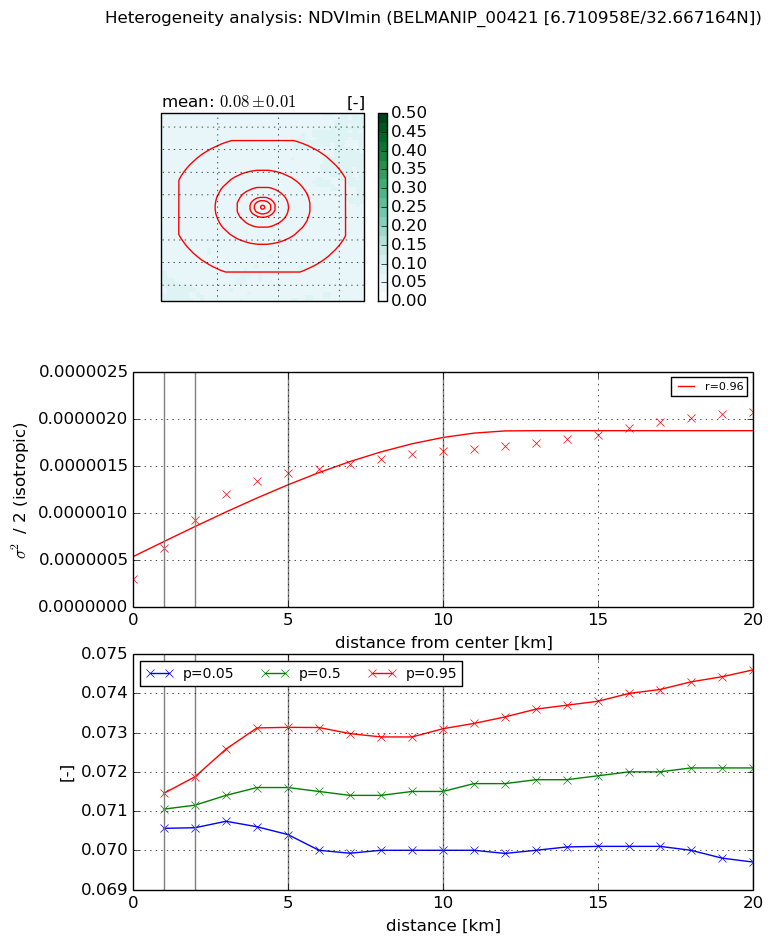
Heterogeneity analysis

The heterogeneity analysis provides information about the spatial and temporal heterogeneity of the site.

Topography


Roman et al. (2009) index


St

5.46361243666

Rcv

-0.0800739760381

Rse

0.0

Rst

-0.0703478785355

Rsv

0.39866540862


Height range @ 1km [m]

21

Height range @ 2km [m]

20

Height range @ 5km [m]

15

Height range @ 10km [m]

-999

Height range @ 20km [m]

-999


Variance slope @ 1 km

19

Variance slope @ 2 km

12

Variance slope @ 5 km

3

Variance slope @ 10 km

-999

Variance slope @ 20 km

-999


NDVI (max. NDVI composite)


Roman et al. (2009) index


St

3.10943927242

Rcv

0.2385515143

Rse

0.0

Rst

0.681778981264

Rsv

0.0444736820283


NDVI range @ 1km [-]

0.0

NDVI range @ 2km [-]

0.0

NDVI range @ 5km [-]

0.0

NDVI range @ 10km [-]

0.0

NDVI range @ 20km [-]

0.0


Variance slope @ 1 km

2.62133291288e-07

Variance slope @ 2 km

2.5165456566e-07

Variance slope @ 5 km

1.96655885376e-07

Variance slope @ 10 km

1.15272777366e-07

Variance slope @ 20 km

6.93451323904e-08


NDVI (min. NDVI composite)I


Roman et al. (2009) index


St

nan

Rcv

nan

Rse

nan

Rst

nan

Rsv

nan


NDVI range @ 1km [-]

0.0

NDVI range @ 2km [-]

0.0

NDVI range @ 5km [-]

0.0

NDVI range @ 10km [-]

0.0

NDVI range @ 20km [-]

0.0


NDVI slope @ 1 km

3.32966070474e-07

NDVI slope @ 2 km

3.12860221658e-07

NDVI slope @ 5 km

2.29302466743e-07

NDVI slope @ 10 km

1.22988736382e-07

NDVI slope @ 20 km

6.79052799143e-08


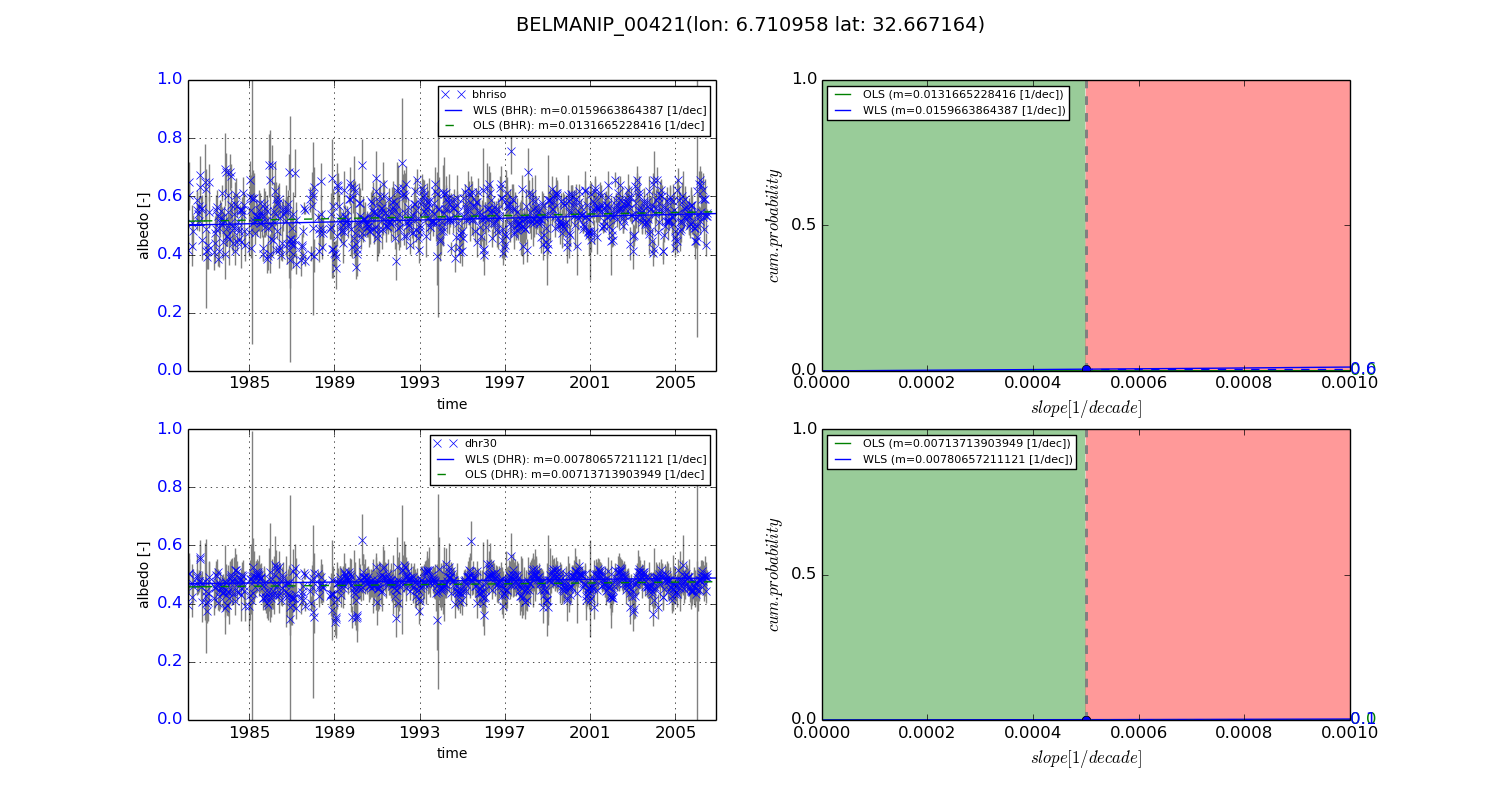
Temporal stability analysis

+000 deg (BHR)


BHR statistics

Temporal stability [1/decade]:


abs

rel


Weighted least square:

0.0159663864387


Ordinary least square:

0.0131665228416


Probabilities that GCOS criteria is met:

Weighted least square:

0.6 %

Ordinary least square:

0.0 %


DHR statistics

Temporal stability [1/decade]:


abs

rel


Weighted least square:

0.00780657211121


Ordinary least square:

0.00713713903949


Probabilities that GCOS criteria is met:

Weighted least square:

0.1 %

Ordinary least square:

0.0 %


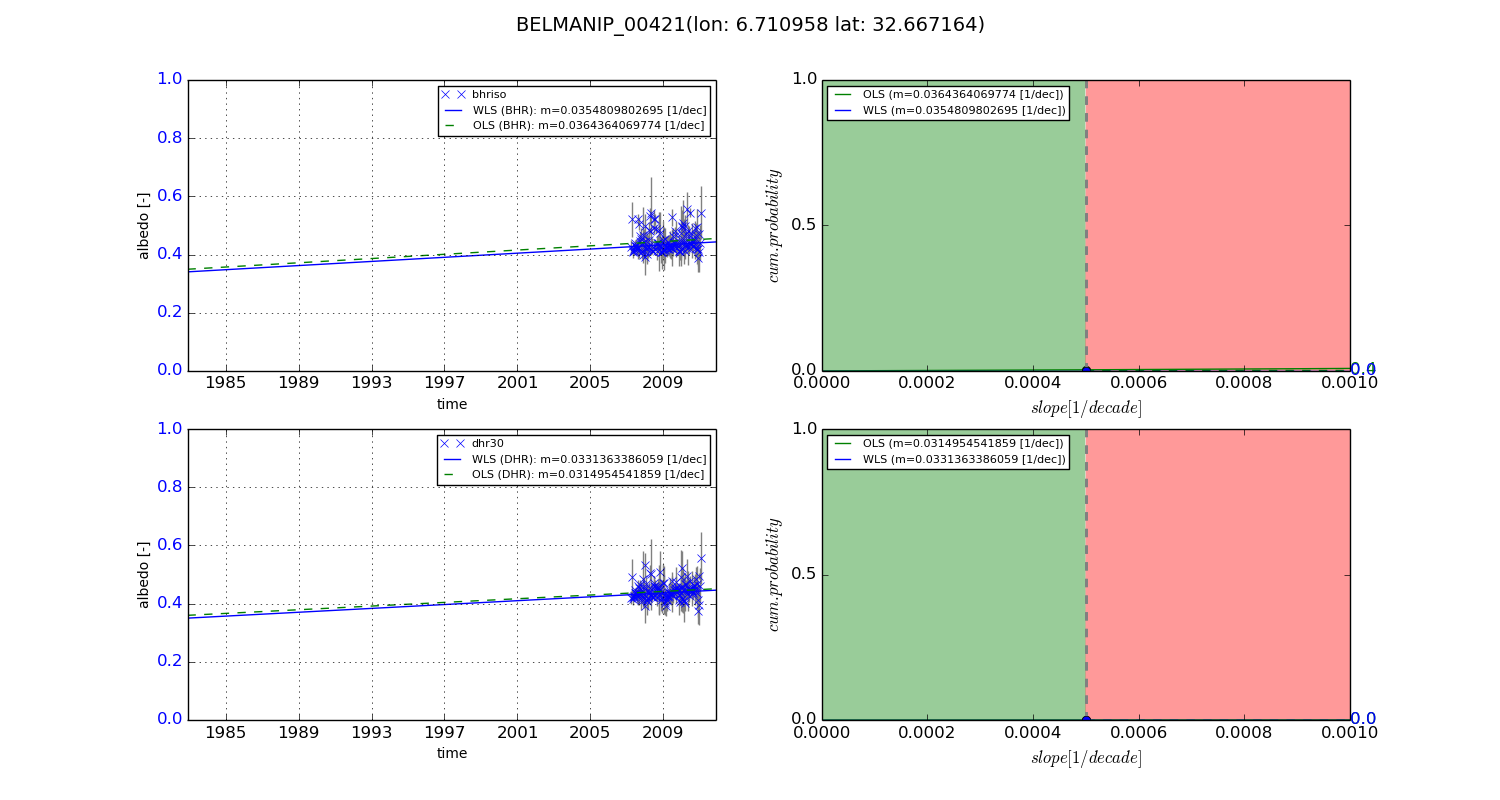
+057/+063 deg (BHR)


BHR statistics

Temporal stability [1/decade]:


abs

rel


Weighted least square:

0.0354809802695


Ordinary least square:

0.0364364069774


Probabilities that GCOS criteria is met:

Weighted least square:

0.0 %

Ordinary least square:

0.4 %


DHR statistics

Temporal stability [1/decade]:


abs

rel


Weighted least square:

0.0331363386059


Ordinary least square:

0.0314954541859


Probabilities that GCOS criteria is met:

Weighted least square:

0.0 %

Ordinary least square:

0.0 %


Temporal anomaly analyis

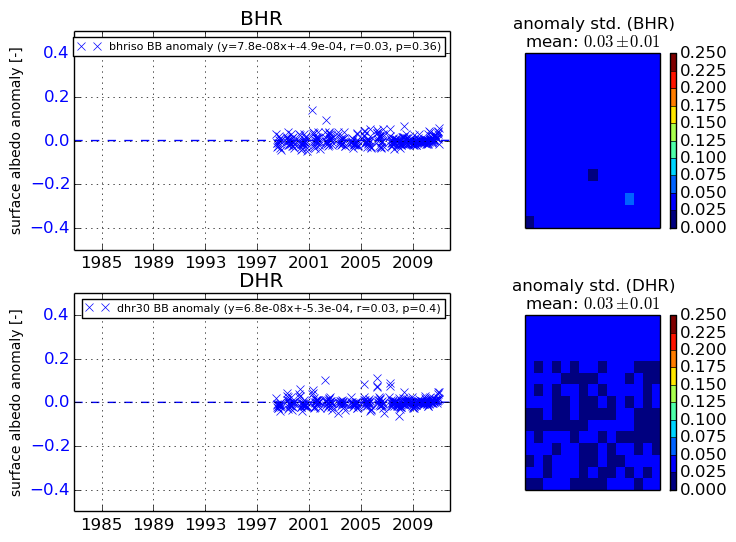
The variance of the temporal anomalies provides an additional measure about the stability of the signal AFTER removal of the mean seasonal cylce.
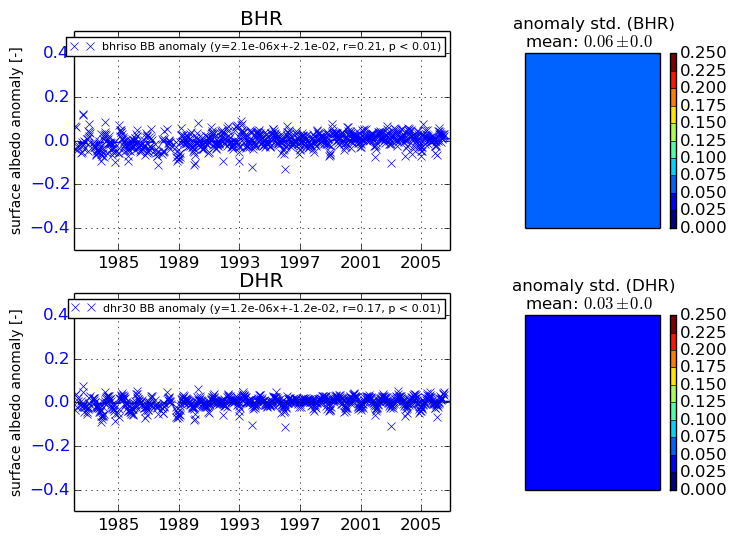
+000 deg


+057/+063 deg