BELMANIP_00424


Location

lon / lat [deg]: 108.9152 / 43.3705

Source network: BELMANIP


Geostationary surface albedo (GSA) data


“+000”


“+057/+063”


Landcover information (based on ESA CCI landcover data)


Landcover fractions @ 2km distance


Landcover fractions @ 20 km distance


Legend


Distance to open water bodies [km]:

30.11

Distance to urban areas [km]:

none in region


Radius: 1 km

Number of landcover classes:

1

Dominant landcover type:

200: bare areas

Fraction of dominant landcover type [%]:

100.0


Radius: 2 km

Number of landcover classes:

1

Dominant landcover type:

200: bare areas

Fraction of dominant landcover type [%]:

100.0


Radius: 5 km

Number of landcover classes:

1

Dominant landcover type:

200: bare areas

Fraction of dominant landcover type [%]:

100.0


Radius: 10 km

Number of landcover classes:

1

Dominant landcover type:

200: bare areas

Fraction of dominant landcover type [%]:

100.0


Radius: 20 km

Number of landcover classes:

1

Dominant landcover type:

200: bare areas

Fraction of dominant landcover type [%]:

100.0


Disturbances


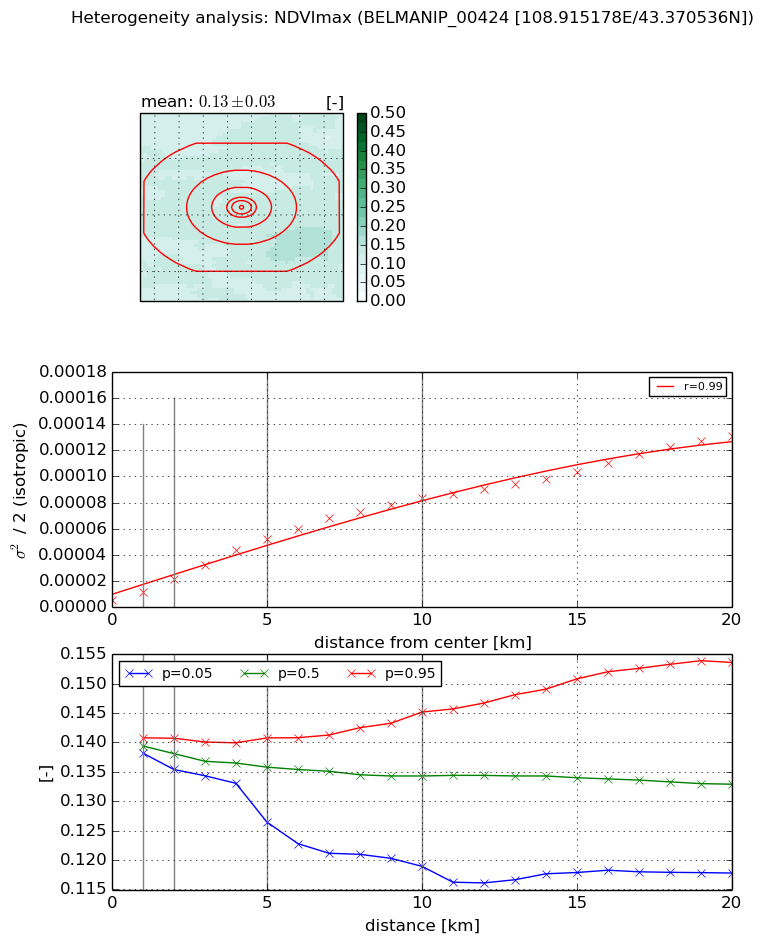
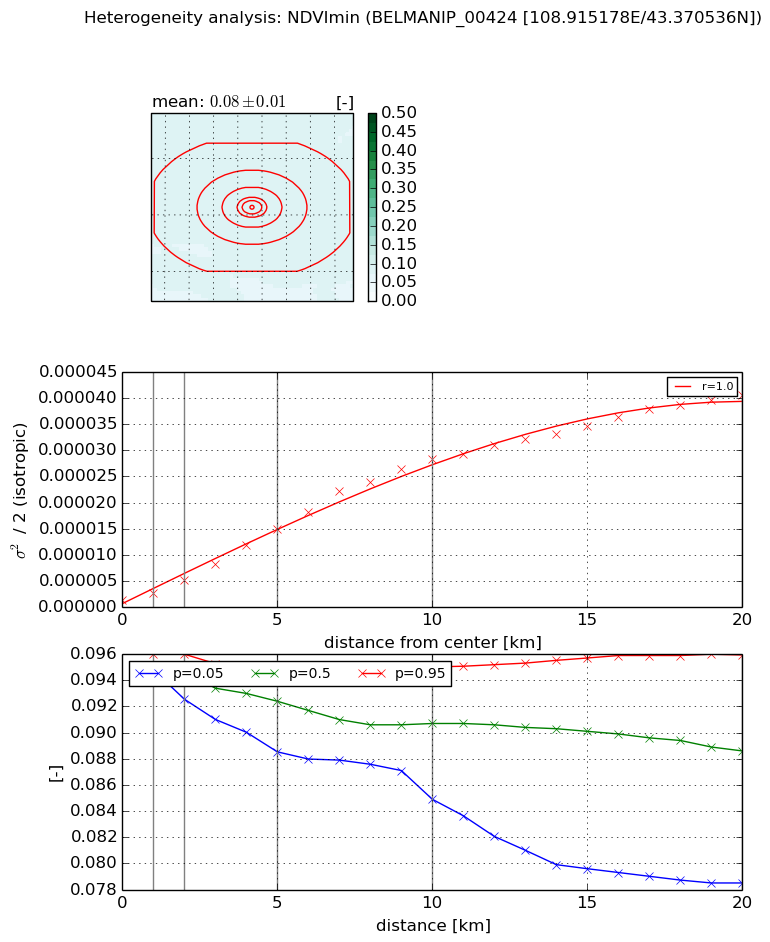
Heterogeneity analysis

The heterogeneity analysis provides information about the spatial and temporal heterogeneity of the site.

Topography


Roman et al. (2009) index


St

3.37306050033e-11

Rcv

0.750300872997

Rse

0.0

Rst

7.15759528536e-07

Rsv

88939999732.7


Height range @ 1km [m]

20

Height range @ 2km [m]

44

Height range @ 5km [m]

119

Height range @ 10km [m]

-999

Height range @ 20km [m]

-999


Variance slope @ 1 km

122

Variance slope @ 2 km

198

Variance slope @ 5 km

354

Variance slope @ 10 km

-999

Variance slope @ 20 km

-999


NDVI (max. NDVI composite)


Roman et al. (2009) index


St

0.638937634862

Rcv

1.13420369616

Rse

0.0

Rst

-0.270377038629

Rsv

3.29071319738


NDVI range @ 1km [-]

0.0

NDVI range @ 2km [-]

0.01

NDVI range @ 5km [-]

0.01

NDVI range @ 10km [-]

0.03

NDVI range @ 20km [-]

0.04


Variance slope @ 1 km

6.17938783647e-06

Variance slope @ 2 km

8.101629945e-06

Variance slope @ 5 km

9.63157566182e-06

Variance slope @ 10 km

8.16090790454e-06

Variance slope @ 20 km

5.99089785622e-06


NDVI (min. NDVI composite)I


Roman et al. (2009) index


St

4.43084368823

Rcv

0.454212525014

Rse

0.0

Rst

-0.0544389746724

Rsv

0.168420455699


NDVI range @ 1km [-]

0.0

NDVI range @ 2km [-]

0.0

NDVI range @ 5km [-]

0.01

NDVI range @ 10km [-]

0.01

NDVI range @ 20km [-]

0.02


NDVI slope @ 1 km

1.43815319201e-06

NDVI slope @ 2 km

1.98093234274e-06

NDVI slope @ 5 km

2.79714098758e-06

NDVI slope @ 10 km

2.90654560187e-06

NDVI slope @ 20 km

2.01585301902e-06


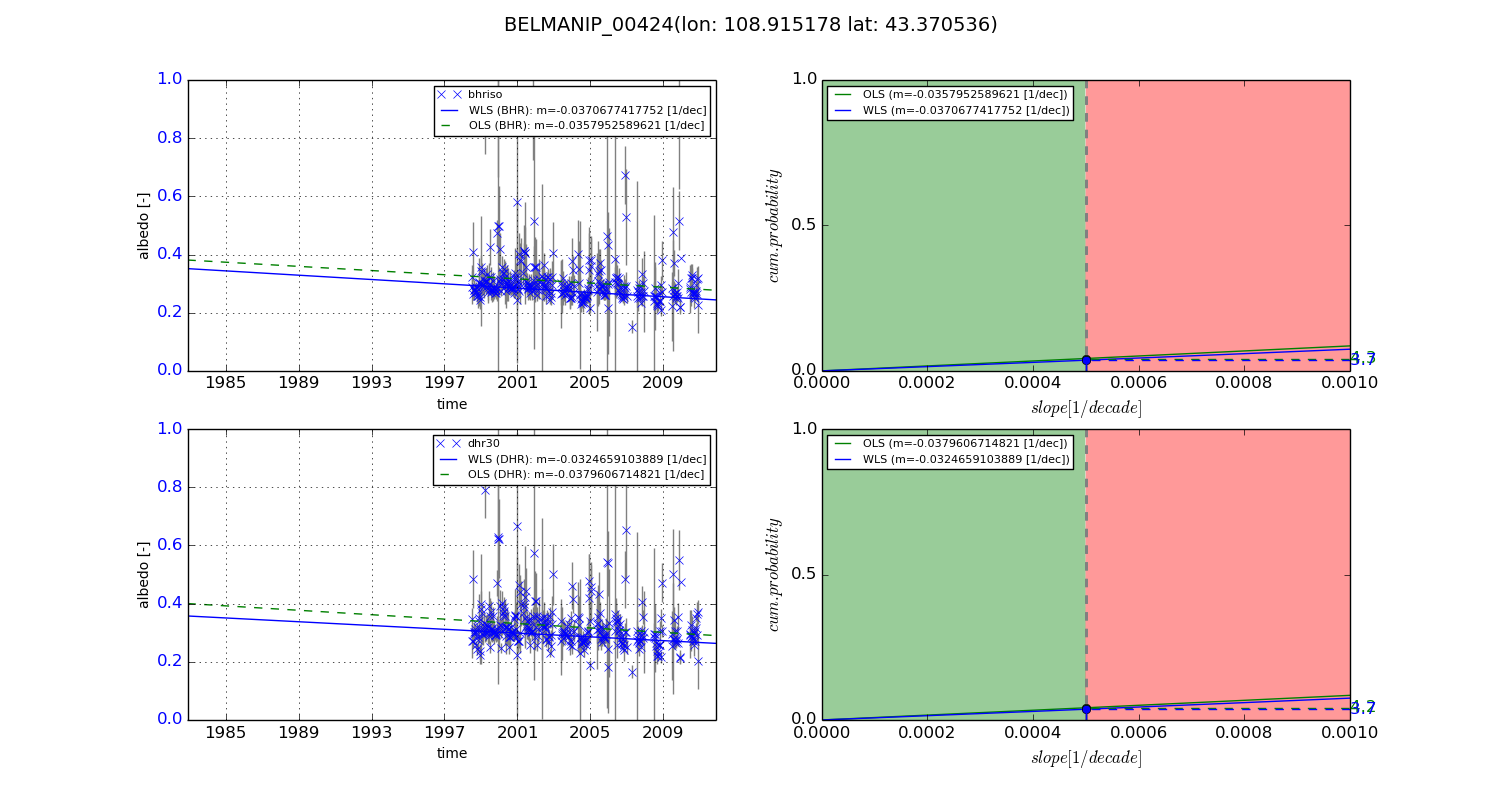
Temporal stability analysis

+000 deg (BHR)


BHR statistics

Temporal stability [1/decade]:


abs

rel


Weighted least square:

None


Ordinary least square:

None


Probabilities that GCOS criteria is met:

Weighted least square:

None %

Ordinary least square:

None %


DHR statistics

Temporal stability [1/decade]:


abs

rel


Weighted least square:

None


Ordinary least square:

None


Probabilities that GCOS criteria is met:

Weighted least square:

None %

Ordinary least square:

None %


+057/+063 deg (BHR)


BHR statistics

Temporal stability [1/decade]:


abs

rel


Weighted least square:

-0.0370677417752


Ordinary least square:

-0.0357952589621


Probabilities that GCOS criteria is met:

Weighted least square:

3.7 %

Ordinary least square:

4.3 %


DHR statistics

Temporal stability [1/decade]:


abs

rel


Weighted least square:

-0.0324659103889


Ordinary least square:

-0.0379606714821


Probabilities that GCOS criteria is met:

Weighted least square:

3.7 %

Ordinary least square:

4.2 %


Temporal anomaly analyis

The variance of the temporal anomalies provides an additional measure about the stability of the signal AFTER removal of the mean seasonal cylce.

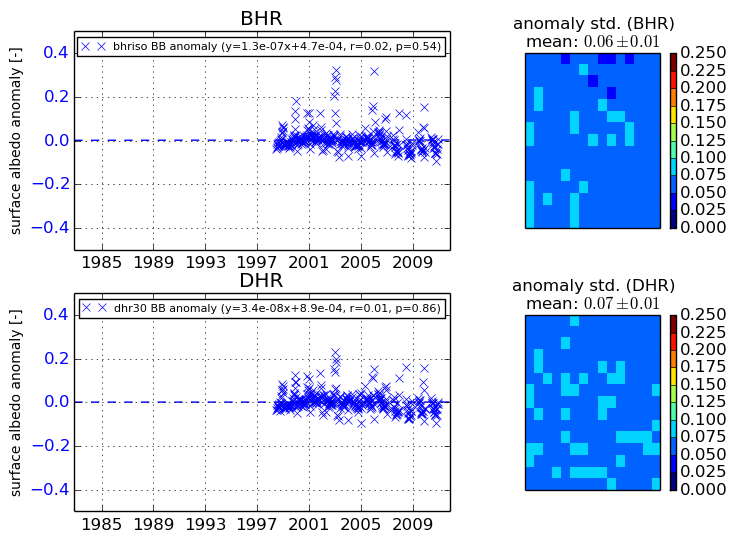
+000 deg


+057/+063 deg