BELMANIP_00425


Location

lon / lat [deg]: -14.4777 / 24.8705

Source network: BELMANIP


Geostationary surface albedo (GSA) data


“+000”


“+057/+063”


Landcover information (based on ESA CCI landcover data)


Landcover fractions @ 2km distance


Landcover fractions @ 20 km distance


Legend


Distance to open water bodies [km]:

28.14

Distance to urban areas [km]:

none in region


Radius: 1 km

Number of landcover classes:

1

Dominant landcover type:

200: bare areas

Fraction of dominant landcover type [%]:

100.0


Radius: 2 km

Number of landcover classes:

1

Dominant landcover type:

200: bare areas

Fraction of dominant landcover type [%]:

100.0


Radius: 5 km

Number of landcover classes:

1

Dominant landcover type:

200: bare areas

Fraction of dominant landcover type [%]:

100.0


Radius: 10 km

Number of landcover classes:

1

Dominant landcover type:

200: bare areas

Fraction of dominant landcover type [%]:

100.0


Radius: 20 km

Number of landcover classes:

1

Dominant landcover type:

200: bare areas

Fraction of dominant landcover type [%]:

100.0


Disturbances


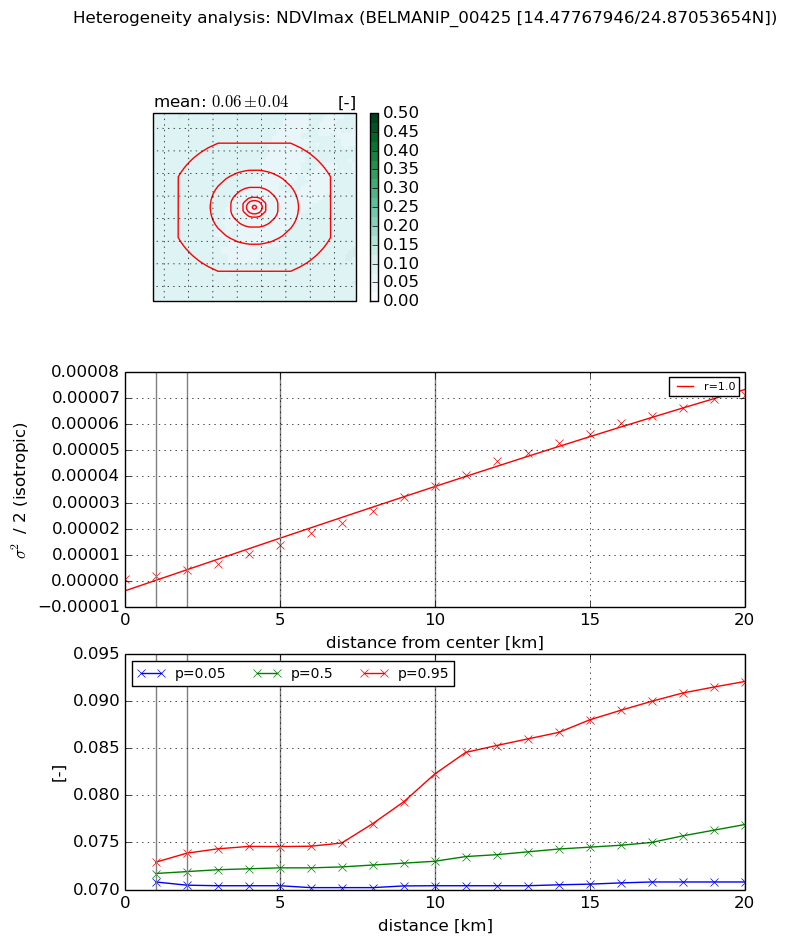
Heterogeneity analysis

The heterogeneity analysis provides information about the spatial and temporal heterogeneity of the site.

Topography


Roman et al. (2009) index


St

0.000366349248126

Rcv

0.291849599805

Rse

0.0

Rst

-0.0368616979877

Rsv

8188.57850045


Height range @ 1km [m]

17

Height range @ 2km [m]

20

Height range @ 5km [m]

34

Height range @ 10km [m]

-999

Height range @ 20km [m]

-999


Variance slope @ 1 km

32

Variance slope @ 2 km

31

Variance slope @ 5 km

19

Variance slope @ 10 km

-999

Variance slope @ 20 km

-999


NDVI (max. NDVI composite)


Roman et al. (2009) index


St

3.1077861948e-06

Rcv

-0.0504107848451

Rse

0.0

Rst

0.362830573899

Rsv

965316.958018


NDVI range @ 1km [-]

0.0

NDVI range @ 2km [-]

0.0

NDVI range @ 5km [-]

0.0

NDVI range @ 10km [-]

0.01

NDVI range @ 20km [-]

0.02


Variance slope @ 1 km

9.33581734422e-07

Variance slope @ 2 km

1.66292494823e-06

Variance slope @ 5 km

2.64214969313e-06

Variance slope @ 10 km

3.69314203448e-06

Variance slope @ 20 km

3.8668471895e-06


NDVI (min. NDVI composite)I


Roman et al. (2009) index


St

2.26274063234e-06

Rcv

-0.0153597528214

Rse

0.0

Rst

0.425233912555

Rsv

1325825.3996


NDVI range @ 1km [-]

0.0

NDVI range @ 2km [-]

0.0

NDVI range @ 5km [-]

0.0

NDVI range @ 10km [-]

0.01

NDVI range @ 20km [-]

0.02


NDVI slope @ 1 km

7.54643942809e-07

NDVI slope @ 2 km

1.35930404709e-06

NDVI slope @ 5 km

2.16846116695e-06

NDVI slope @ 10 km

3.03832497082e-06

NDVI slope @ 20 km

3.26700679605e-06


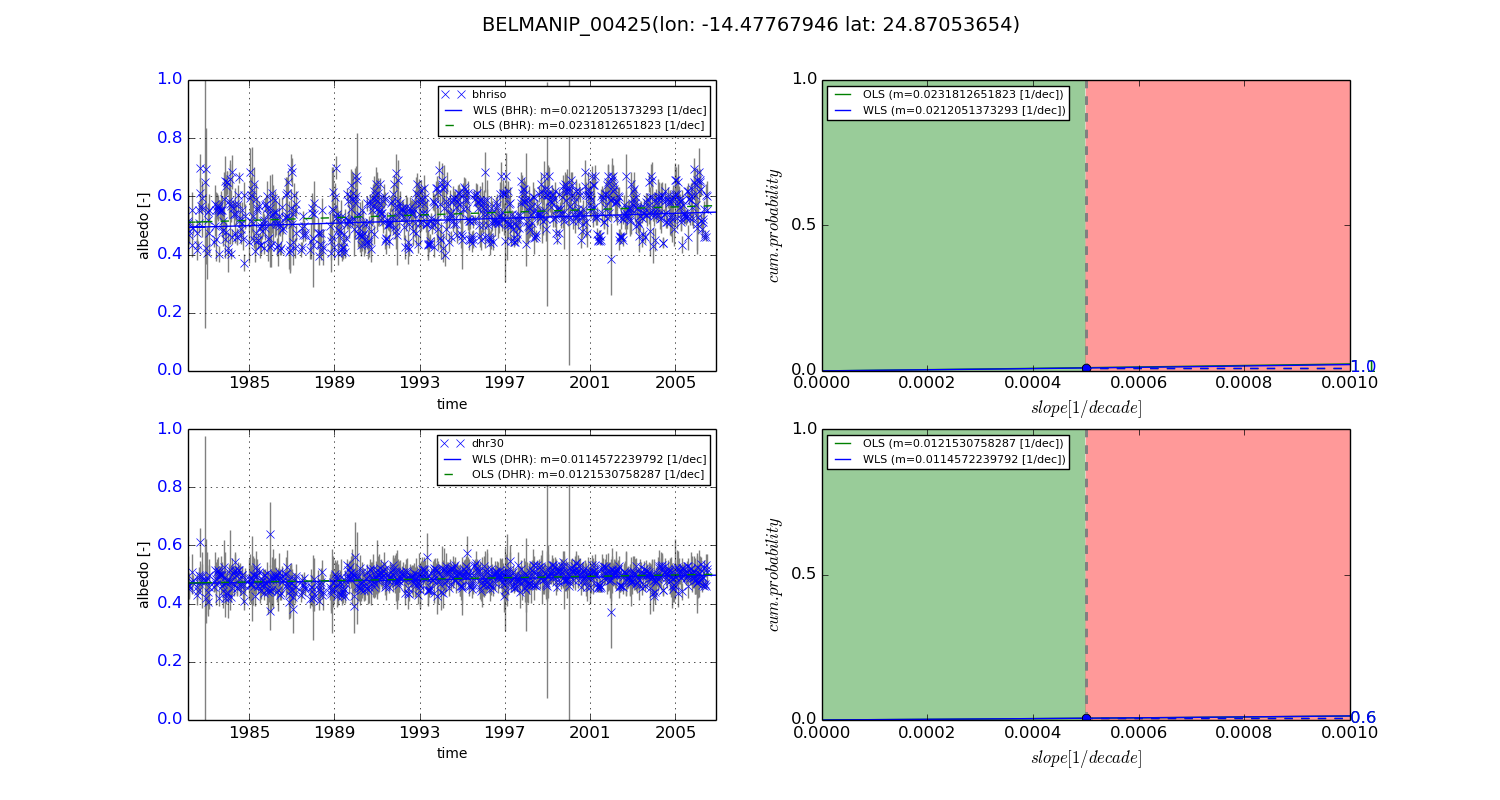
Temporal stability analysis

+000 deg (BHR)


BHR statistics

Temporal stability [1/decade]:


abs

rel


Weighted least square:

0.0212051373293


Ordinary least square:

0.0231812651823


Probabilities that GCOS criteria is met:

Weighted least square:

1.0 %

Ordinary least square:

1.1 %


DHR statistics

Temporal stability [1/decade]:


abs

rel


Weighted least square:

0.0114572239792


Ordinary least square:

0.0121530758287


Probabilities that GCOS criteria is met:

Weighted least square:

0.6 %

Ordinary least square:

0.6 %


+057/+063 deg (BHR)


BHR statistics

Temporal stability [1/decade]:


abs

rel


Weighted least square:

-99999.0


Ordinary least square:

-99999.0


Probabilities that GCOS criteria is met:

Weighted least square:

-99999.0 %

Ordinary least square:

-99999.0 %


DHR statistics

Temporal stability [1/decade]:


abs

rel


Weighted least square:

-99999.0


Ordinary least square:

-99999.0


Probabilities that GCOS criteria is met:

Weighted least square:

-99999.0 %

Ordinary least square:

-99999.0 %


Temporal anomaly analyis

The variance of the temporal anomalies provides an additional measure about the stability of the signal AFTER removal of the mean seasonal cylce.
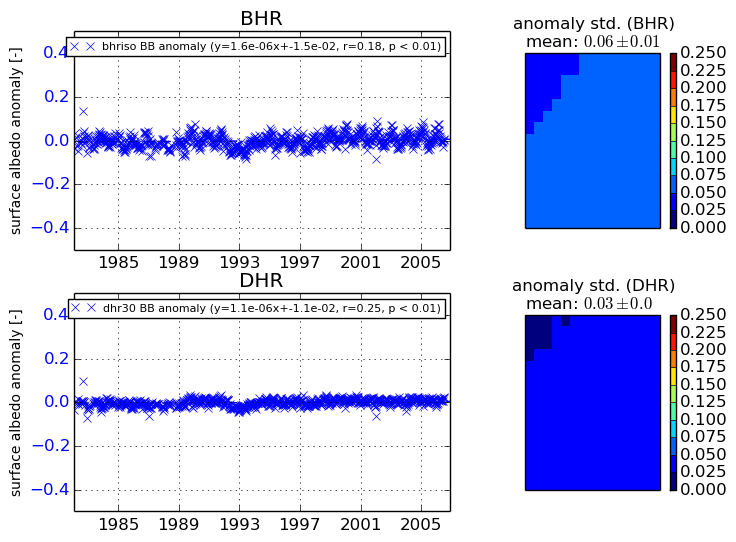
+000 deg


+057/+063 deg