BELMANIP_00426


Location

lon / lat [deg]: -8.058 / 20.5313

Source network: BELMANIP


Geostationary surface albedo (GSA) data


“+000”


“+057/+063”


Landcover information (based on ESA CCI landcover data)


Landcover fractions @ 2km distance


Landcover fractions @ 20 km distance


Legend


Distance to open water bodies [km]:

none in region

Distance to urban areas [km]:

none in region


Radius: 1 km

Number of landcover classes:

1

Dominant landcover type:

200: bare areas

Fraction of dominant landcover type [%]:

100.0


Radius: 2 km

Number of landcover classes:

1

Dominant landcover type:

200: bare areas

Fraction of dominant landcover type [%]:

100.0


Radius: 5 km

Number of landcover classes:

1

Dominant landcover type:

200: bare areas

Fraction of dominant landcover type [%]:

100.0


Radius: 10 km

Number of landcover classes:

1

Dominant landcover type:

200: bare areas

Fraction of dominant landcover type [%]:

100.0


Radius: 20 km

Number of landcover classes:

1

Dominant landcover type:

200: bare areas

Fraction of dominant landcover type [%]:

100.0


Disturbances


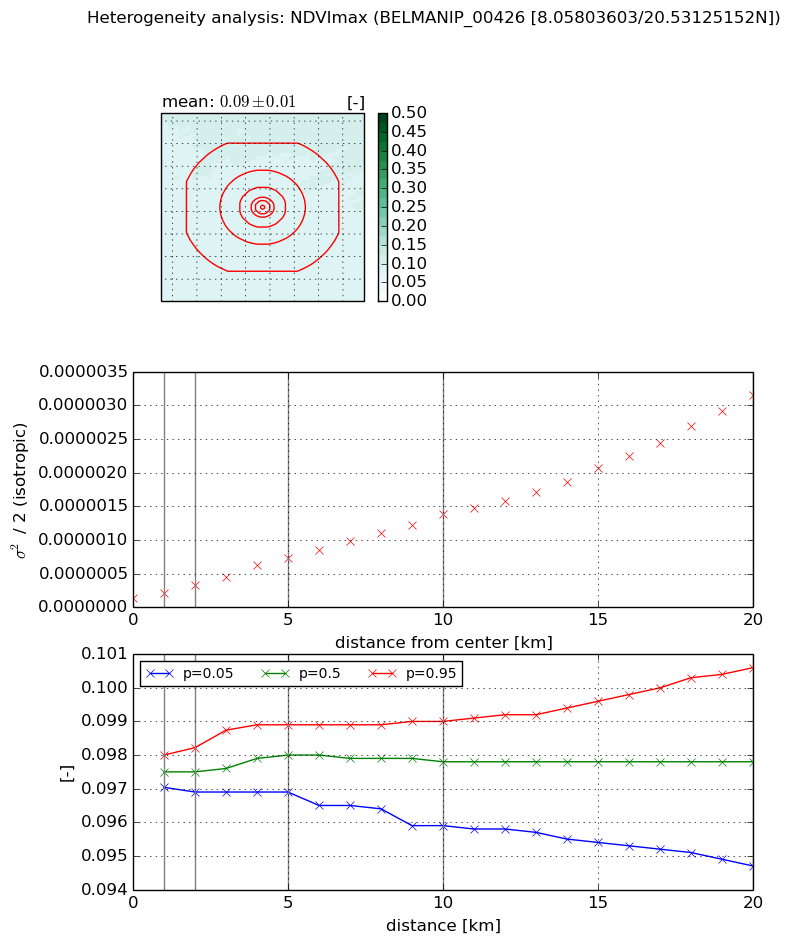
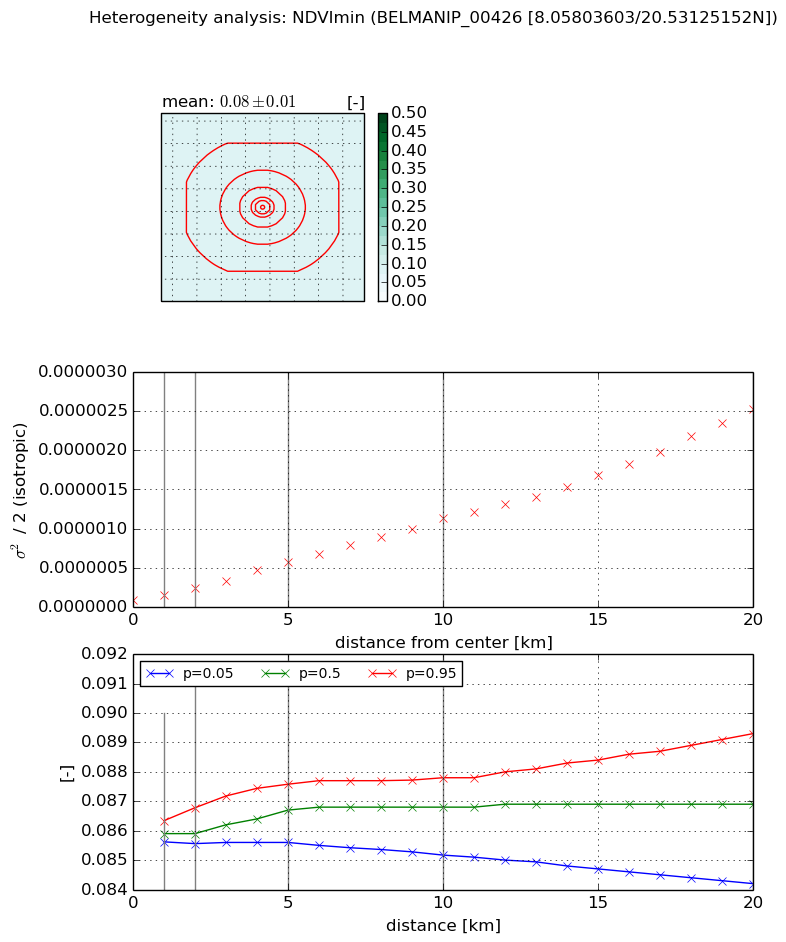
Heterogeneity analysis

The heterogeneity analysis provides information about the spatial and temporal heterogeneity of the site.

Topography


Roman et al. (2009) index


St

11.3885114913

Rcv

0.0372548381922

Rse

0.0

Rst

-0.0445309520556

Rsv

0.181637573051


Height range @ 1km [m]

15

Height range @ 2km [m]

22

Height range @ 5km [m]

23

Height range @ 10km [m]

-999

Height range @ 20km [m]

-999


Variance slope @ 1 km

42

Variance slope @ 2 km

15

Variance slope @ 5 km

4

Variance slope @ 10 km

-999

Variance slope @ 20 km

-999


NDVI (max. NDVI composite)


Roman et al. (2009) index


St

13.3207991806

Rcv

0.126256022644

Rse

0.0

Rst

0.0385786186725

Rsv

-0.0603770715339


NDVI range @ 1km [-]

0.0

NDVI range @ 2km [-]

0.0

NDVI range @ 5km [-]

0.0

NDVI range @ 10km [-]

0.0

NDVI range @ 20km [-]

0.01


Variance slope @ 1 km

7.54191327193e-08

Variance slope @ 2 km

9.71695503899e-08

Variance slope @ 5 km

1.23890966938e-07

Variance slope @ 10 km

1.26894017122e-07

Variance slope @ 20 km

1.44656905016e-07


NDVI (min. NDVI composite)I


Roman et al. (2009) index


St

10.7576834518

Rcv

0.203240037909

Rse

0.0

Rst

-0.0266543466513

Rsv

0.0489760630996


NDVI range @ 1km [-]

0.0

NDVI range @ 2km [-]

0.0

NDVI range @ 5km [-]

0.0

NDVI range @ 10km [-]

0.0

NDVI range @ 20km [-]

0.01


NDVI slope @ 1 km

5.6083539182e-08

NDVI slope @ 2 km

7.41642573492e-08

NDVI slope @ 5 km

9.82206973633e-08

NDVI slope @ 10 km

1.06103822945e-07

NDVI slope @ 20 km

1.18174875478e-07


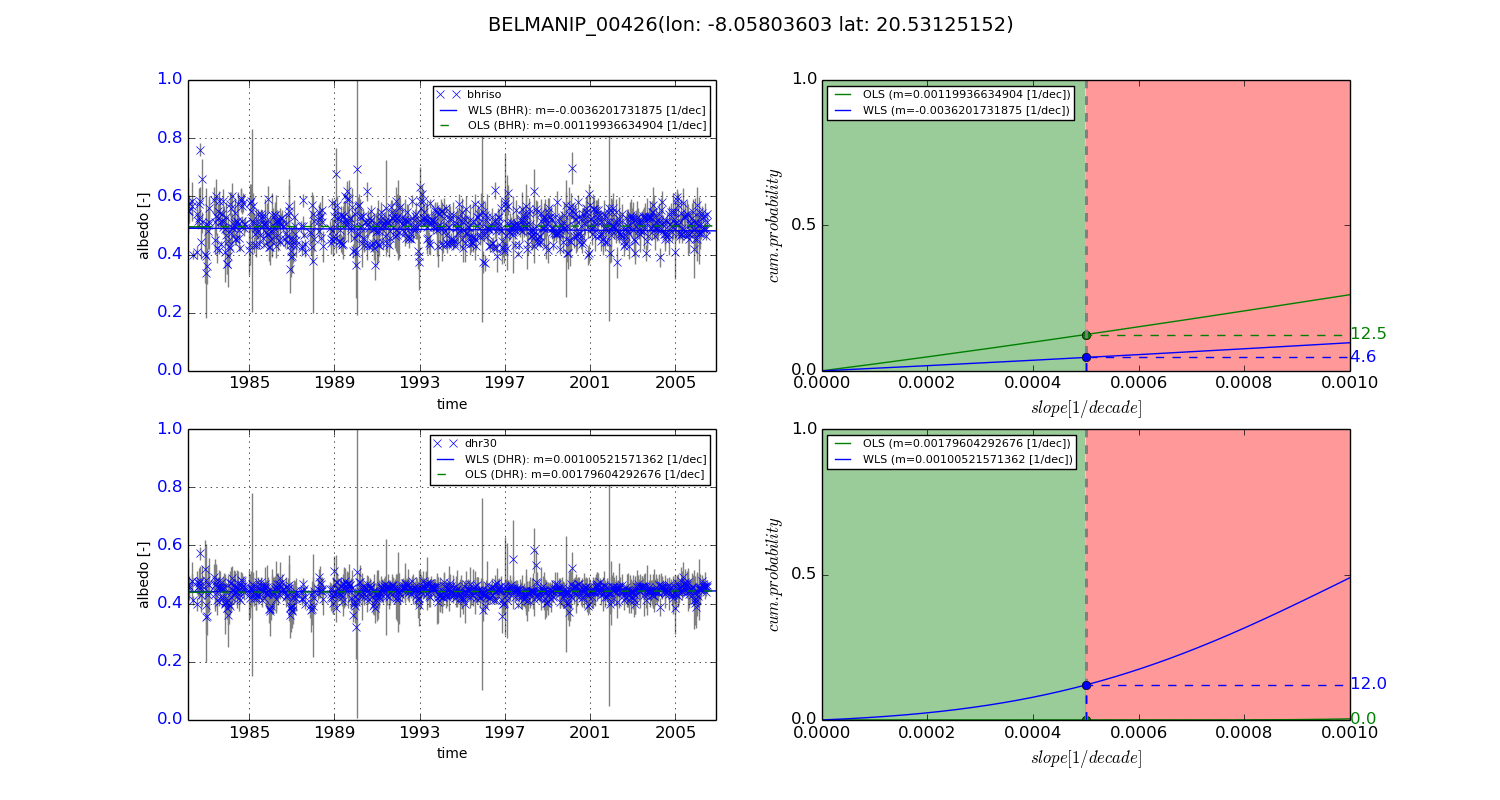
Temporal stability analysis

+000 deg (BHR)


BHR statistics

Temporal stability [1/decade]:


abs

rel


Weighted least square:

-0.0036201731875


Ordinary least square:

0.00119936634904


Probabilities that GCOS criteria is met:

Weighted least square:

4.6 %

Ordinary least square:

12.5 %


DHR statistics

Temporal stability [1/decade]:


abs

rel


Weighted least square:

0.00100521571362


Ordinary least square:

0.00179604292676


Probabilities that GCOS criteria is met:

Weighted least square:

12.0 %

Ordinary least square:

0.0 %


+057/+063 deg (BHR)


BHR statistics

Temporal stability [1/decade]:


abs

rel


Weighted least square:

-99999.0


Ordinary least square:

-99999.0


Probabilities that GCOS criteria is met:

Weighted least square:

-99999.0 %

Ordinary least square:

-99999.0 %


DHR statistics

Temporal stability [1/decade]:


abs

rel


Weighted least square:

-99999.0


Ordinary least square:

-99999.0


Probabilities that GCOS criteria is met:

Weighted least square:

-99999.0 %

Ordinary least square:

-99999.0 %


Temporal anomaly analyis

The variance of the temporal anomalies provides an additional measure about the stability of the signal AFTER removal of the mean seasonal cylce.
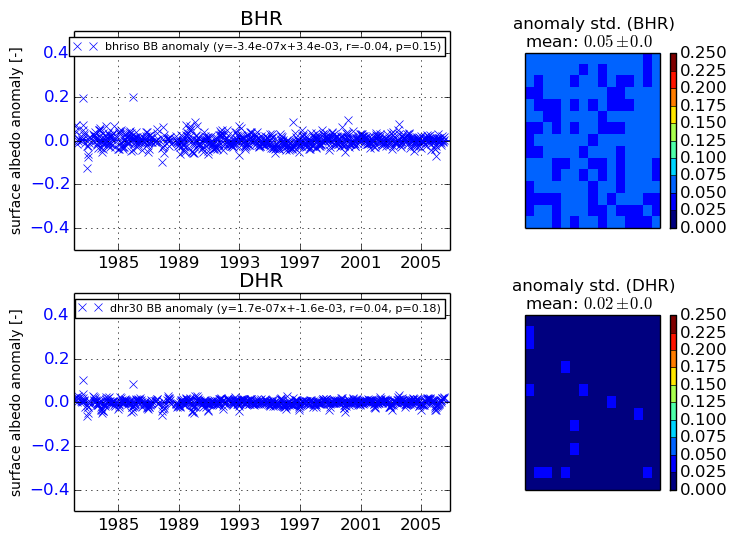
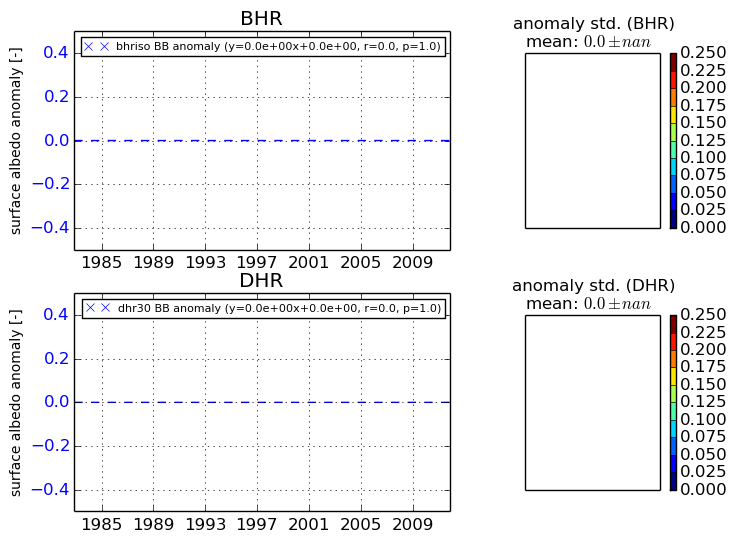
+000 deg


+057/+063 deg