BELMANIP_00439


Location

lon / lat [deg]: 105.5051 / 18.2891

Source network: BELMANIP


Geostationary surface albedo (GSA) data


“+000”


“+057/+063”


Landcover information (based on ESA CCI landcover data)


Landcover fractions @ 2km distance


Landcover fractions @ 20 km distance


Legend


Distance to open water bodies [km]:

8.25

Distance to urban areas [km]:

16.14


Radius: 1 km

Number of landcover classes:

1

Dominant landcover type:

50: Tree cover, broadleaved, evergreen, closed to open (>15%)

Fraction of dominant landcover type [%]:

100.0


Radius: 2 km

Number of landcover classes:

1

Dominant landcover type:

50: Tree cover, broadleaved, evergreen, closed to open (>15%)

Fraction of dominant landcover type [%]:

99.0


Radius: 5 km

Number of landcover classes:

2

Dominant landcover type:

50: Tree cover, broadleaved, evergreen, closed to open (>15%)

Fraction of dominant landcover type [%]:

89.0


Radius: 10 km

Number of landcover classes:

5

Dominant landcover type:

50: Tree cover, broadleaved, evergreen, closed to open (>15%)

Fraction of dominant landcover type [%]:

80.0


Radius: 20 km

Number of landcover classes:

6

Dominant landcover type:

50: Tree cover, broadleaved, evergreen, closed to open (>15%)

Fraction of dominant landcover type [%]:

58.0


Disturbances


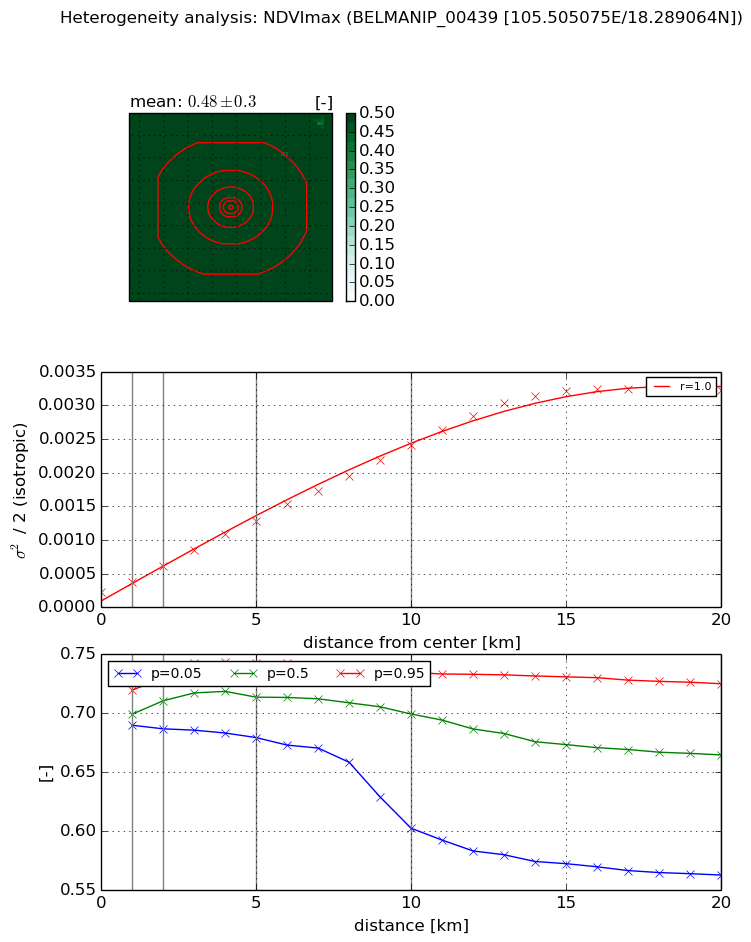
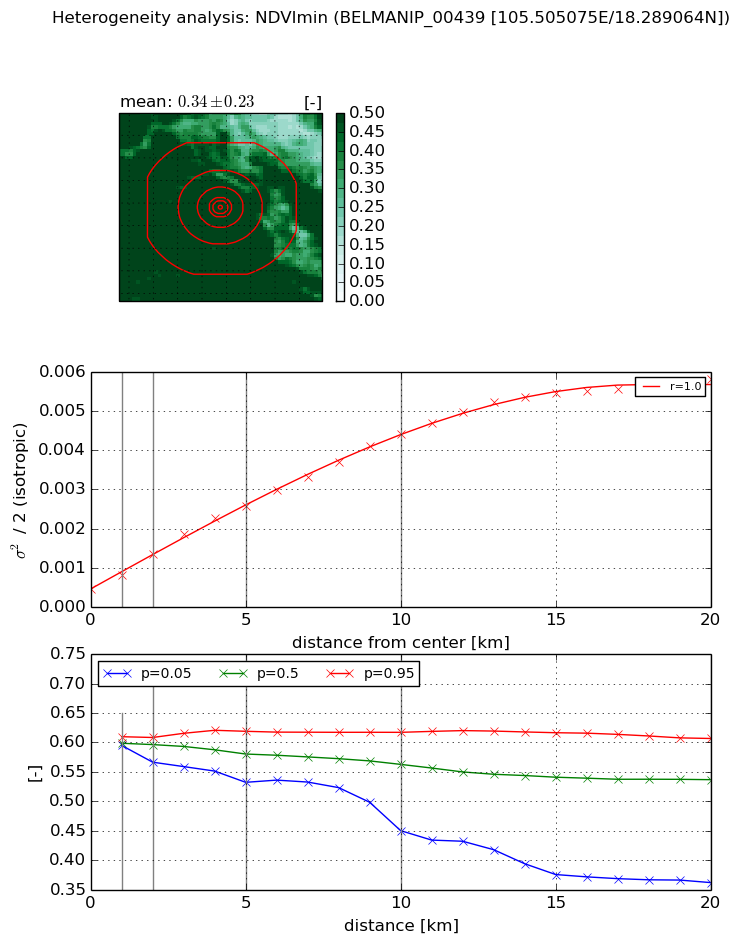
Heterogeneity analysis

The heterogeneity analysis provides information about the spatial and temporal heterogeneity of the site.

Topography


Roman et al. (2009) index


St

8.22729289089e-05

Rcv

0.497211276603

Rse

0.0

Rst

0.00333848222404

Rsv

36463.4984811


Height range @ 1km [m]

267

Height range @ 2km [m]

327

Height range @ 5km [m]

454

Height range @ 10km [m]

-999

Height range @ 20km [m]

-999


Variance slope @ 1 km

6885

Variance slope @ 2 km

6972

Variance slope @ 5 km

4786

Variance slope @ 10 km

-999

Variance slope @ 20 km

-999


NDVI (max. NDVI composite)


Roman et al. (2009) index


St

2.10442844037

Rcv

0.0427585105968

Rse

0.0

Rst

-0.0429290667934

Rsv

1.33987764614


NDVI range @ 1km [-]

0.03

NDVI range @ 2km [-]

0.04

NDVI range @ 5km [-]

0.06

NDVI range @ 10km [-]

0.13

NDVI range @ 20km [-]

0.16


Variance slope @ 1 km

0.000148627808724

Variance slope @ 2 km

0.000192577081884

Variance slope @ 5 km

0.000217833934645

Variance slope @ 10 km

0.000221002436111

Variance slope @ 20 km

0.000166846498899


NDVI (min. NDVI composite)I


Roman et al. (2009) index


St

3.06387677903e-06

Rcv

0.213811823295

Rse

0.0

Rst

0.118414147927

Rsv

979151.316603


NDVI range @ 1km [-]

0.01

NDVI range @ 2km [-]

0.04

NDVI range @ 5km [-]

0.09

NDVI range @ 10km [-]

0.17

NDVI range @ 20km [-]

0.24


NDVI slope @ 1 km

0.000354256846889

NDVI slope @ 2 km

0.000448250637841

NDVI slope @ 5 km

0.000440739477558

NDVI slope @ 10 km

0.000396632628119

NDVI slope @ 20 km

0.000272671128692


Temporal stability analysis

+000 deg (BHR)


BHR statistics

Temporal stability [1/decade]:


abs

rel


Weighted least square:

None


Ordinary least square:

None


Probabilities that GCOS criteria is met:

Weighted least square:

None %

Ordinary least square:

None %


DHR statistics

Temporal stability [1/decade]:


abs

rel


Weighted least square:

None


Ordinary least square:

None


Probabilities that GCOS criteria is met:

Weighted least square:

None %

Ordinary least square:

None %


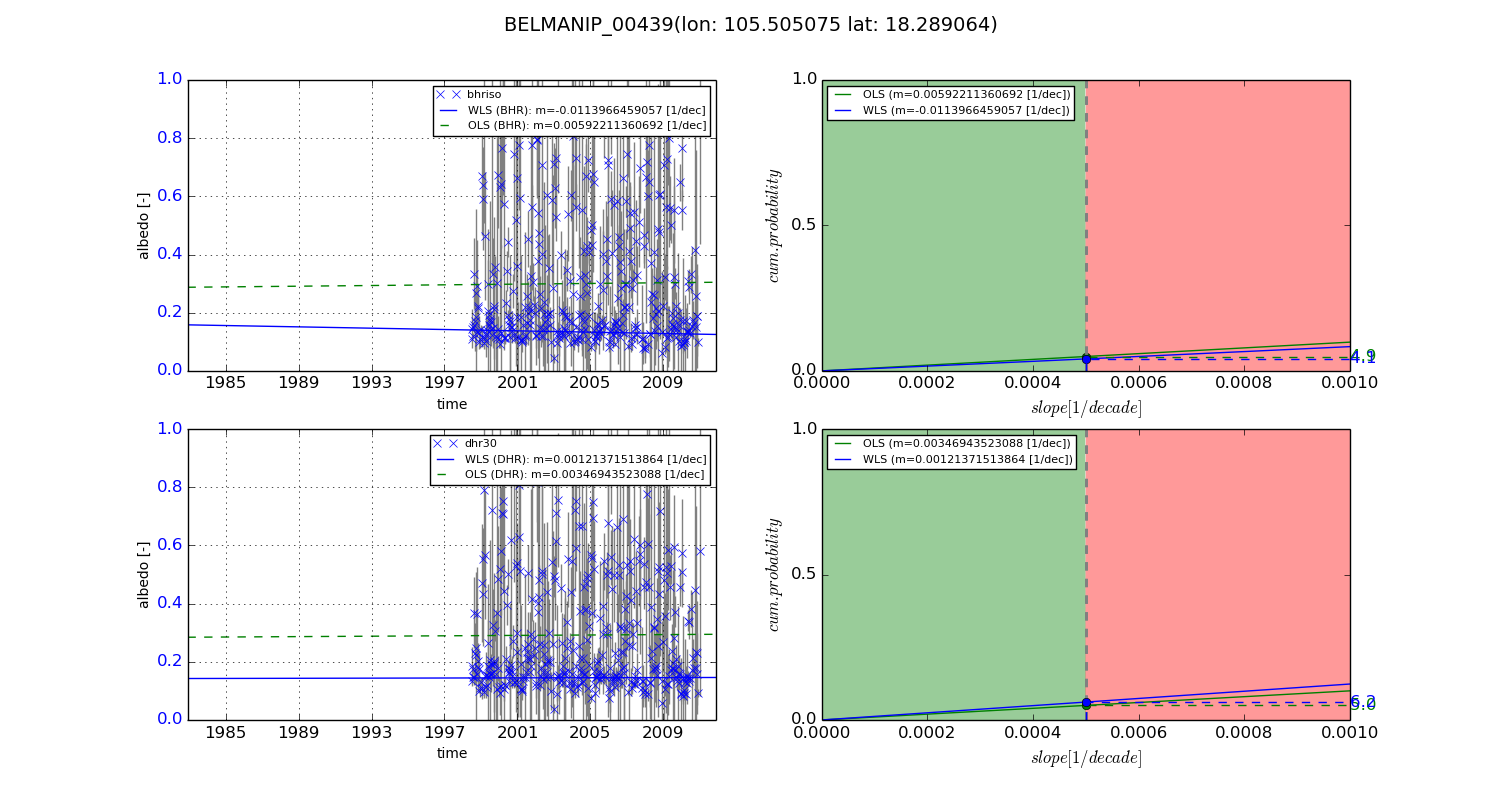
+057/+063 deg (BHR)


BHR statistics

Temporal stability [1/decade]:


abs

rel


Weighted least square:

-0.0113966459057


Ordinary least square:

0.00592211360692


Probabilities that GCOS criteria is met:

Weighted least square:

4.1 %

Ordinary least square:

4.9 %


DHR statistics

Temporal stability [1/decade]:


abs

rel


Weighted least square:

0.00121371513864


Ordinary least square:

0.00346943523088


Probabilities that GCOS criteria is met:

Weighted least square:

6.2 %

Ordinary least square:

5.0 %


Temporal anomaly analyis

The variance of the temporal anomalies provides an additional measure about the stability of the signal AFTER removal of the mean seasonal cylce.

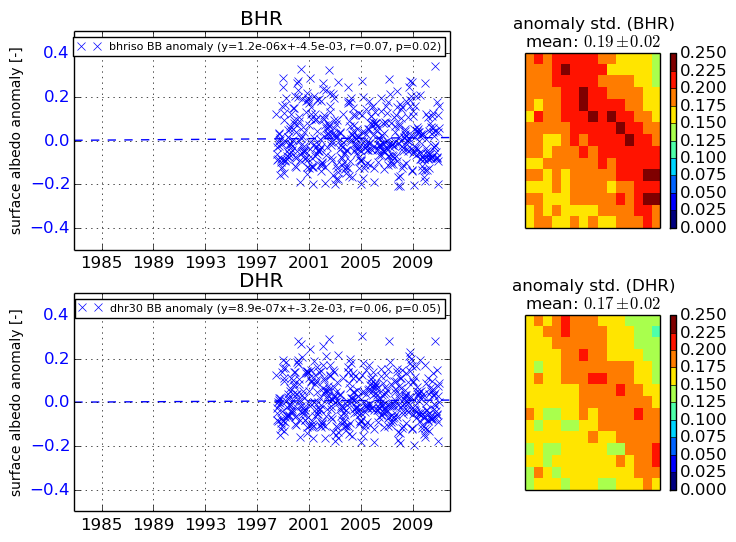
+000 deg


+057/+063 deg