BELMANIP_00440


Location

lon / lat [deg]: 97.5619 / 26.79

Source network: BELMANIP


Geostationary surface albedo (GSA) data


“+000”


“+057/+063”


Landcover information (based on ESA CCI landcover data)


Landcover fractions @ 2km distance


Landcover fractions @ 20 km distance


Legend


Distance to open water bodies [km]:

19.66

Distance to urban areas [km]:

14.71


Radius: 1 km

Number of landcover classes:

2

Dominant landcover type:

50: Tree cover, broadleaved, evergreen, closed to open (>15%)

Fraction of dominant landcover type [%]:

81.0


Radius: 2 km

Number of landcover classes:

2

Dominant landcover type:

50: Tree cover, broadleaved, evergreen, closed to open (>15%)

Fraction of dominant landcover type [%]:

71.0


Radius: 5 km

Number of landcover classes:

3

Dominant landcover type:

50: Tree cover, broadleaved, evergreen, closed to open (>15%)

Fraction of dominant landcover type [%]:

84.0


Radius: 10 km

Number of landcover classes:

2

Dominant landcover type:

50: Tree cover, broadleaved, evergreen, closed to open (>15%)

Fraction of dominant landcover type [%]:

85.0


Radius: 20 km

Number of landcover classes:

2

Dominant landcover type:

50: Tree cover, broadleaved, evergreen, closed to open (>15%)

Fraction of dominant landcover type [%]:

87.0


Disturbances


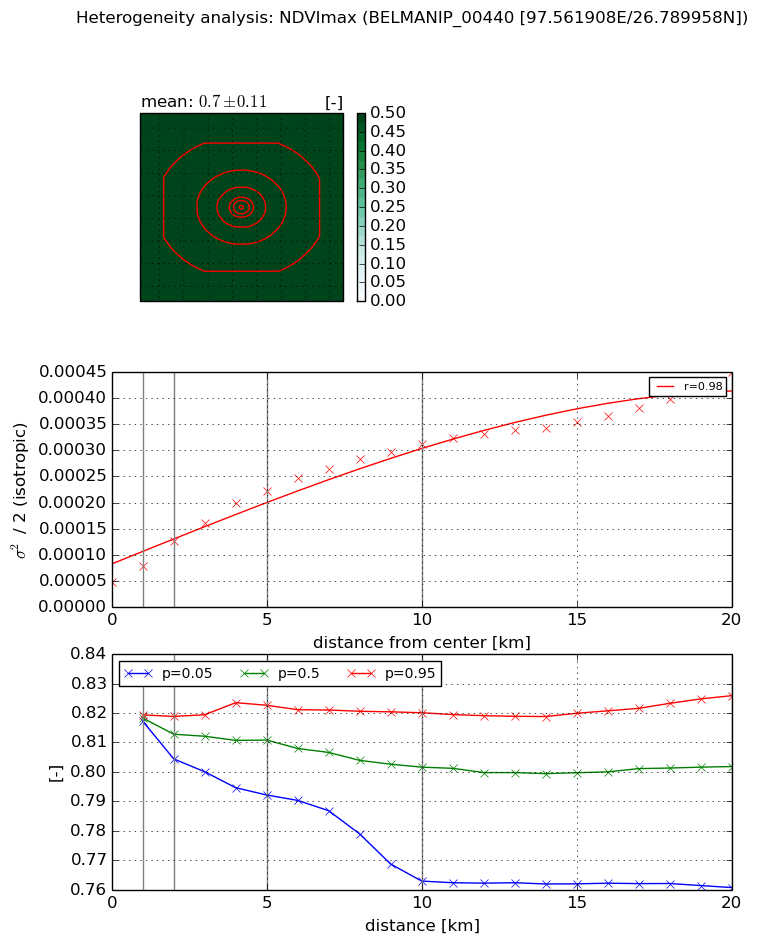
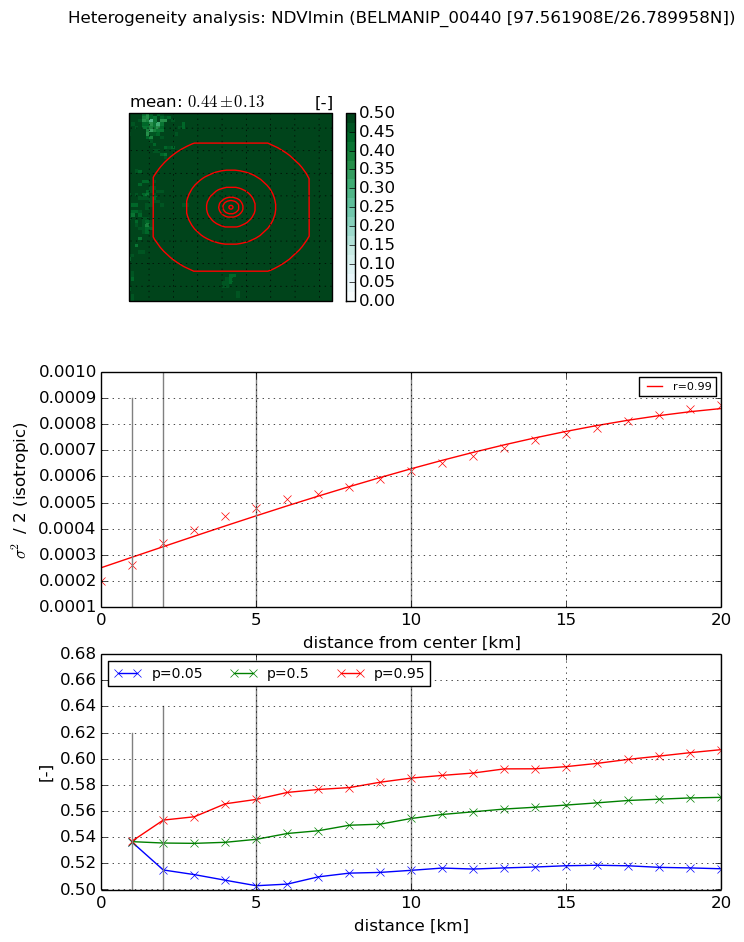
Heterogeneity analysis

The heterogeneity analysis provides information about the spatial and temporal heterogeneity of the site.

Topography


Roman et al. (2009) index


St

6.7427932279

Rcv

0.300261785809

Rse

0.0

Rst

-0.0870729896877

Rsv

0.0575846960942


Height range @ 1km [m]

127

Height range @ 2km [m]

142

Height range @ 5km [m]

210

Height range @ 10km [m]

-999

Height range @ 20km [m]

-999


Variance slope @ 1 km

2222

Variance slope @ 2 km

1839

Variance slope @ 5 km

965

Variance slope @ 10 km

-999

Variance slope @ 20 km

-999


NDVI (max. NDVI composite)


Roman et al. (2009) index


St

7.78213584404e-08

Rcv

0.285764362302

Rse

0.0

Rst

0.244785158037

Rsv

38549827.693


NDVI range @ 1km [-]

0.0

NDVI range @ 2km [-]

0.01

NDVI range @ 5km [-]

0.03

NDVI range @ 10km [-]

0.06

NDVI range @ 20km [-]

0.07


Variance slope @ 1 km

2.96319670302e-05

Variance slope @ 2 km

3.90252207791e-05

Variance slope @ 5 km

3.6004352708e-05

Variance slope @ 10 km

2.65245895899e-05

Variance slope @ 20 km

1.71707193551e-05


NDVI (min. NDVI composite)I


Roman et al. (2009) index


St

1.21396704253

Rcv

0.500332221066

Rse

0.0

Rst

-0.366039258502

Rsv

1.60486529614


NDVI range @ 1km [-]

0.0

NDVI range @ 2km [-]

0.04

NDVI range @ 5km [-]

0.07

NDVI range @ 10km [-]

0.07

NDVI range @ 20km [-]

0.09


NDVI slope @ 1 km

6.10572168702e-05

NDVI slope @ 2 km

7.27770632056e-05

NDVI slope @ 5 km

5.80308133066e-05

NDVI slope @ 10 km

4.02087652247e-05

NDVI slope @ 20 km

3.12846492256e-05


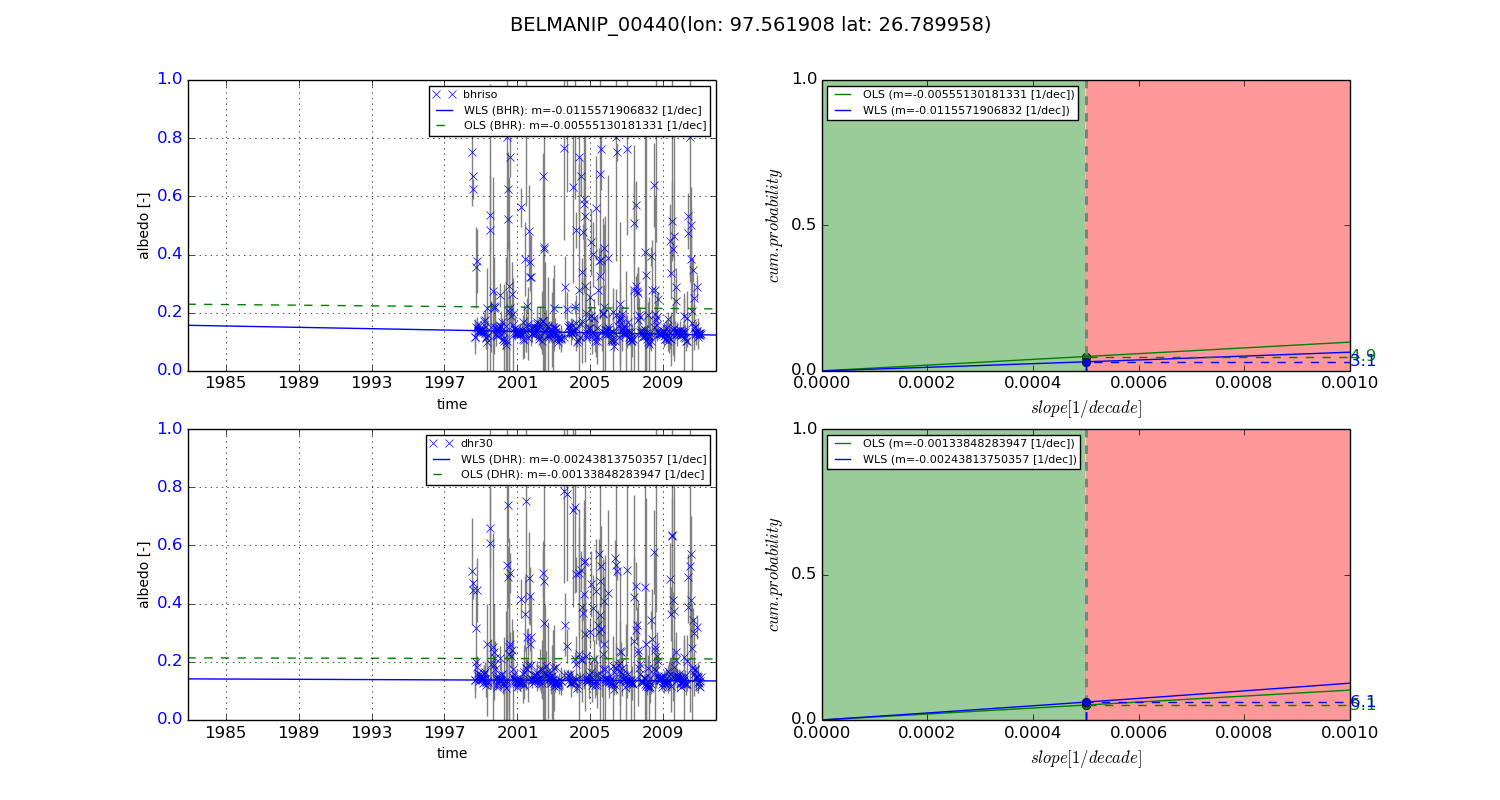
Temporal stability analysis

+000 deg (BHR)


BHR statistics

Temporal stability [1/decade]:


abs

rel


Weighted least square:

None


Ordinary least square:

None


Probabilities that GCOS criteria is met:

Weighted least square:

None %

Ordinary least square:

None %


DHR statistics

Temporal stability [1/decade]:


abs

rel


Weighted least square:

None


Ordinary least square:

None


Probabilities that GCOS criteria is met:

Weighted least square:

None %

Ordinary least square:

None %


+057/+063 deg (BHR)


BHR statistics

Temporal stability [1/decade]:


abs

rel


Weighted least square:

-0.0115571906832


Ordinary least square:

-0.00555130181331


Probabilities that GCOS criteria is met:

Weighted least square:

3.1 %

Ordinary least square:

4.9 %


DHR statistics

Temporal stability [1/decade]:


abs

rel


Weighted least square:

-0.00243813750357


Ordinary least square:

-0.00133848283947


Probabilities that GCOS criteria is met:

Weighted least square:

6.1 %

Ordinary least square:

5.1 %


Temporal anomaly analyis

The variance of the temporal anomalies provides an additional measure about the stability of the signal AFTER removal of the mean seasonal cylce.

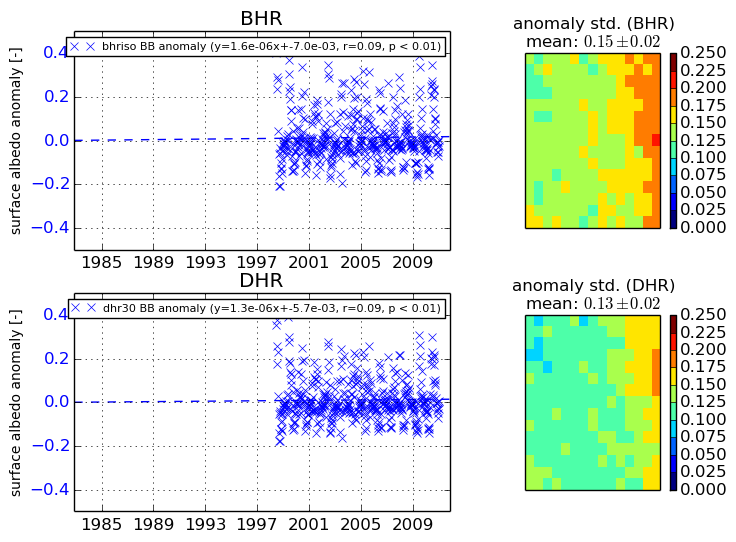
+000 deg


+057/+063 deg