BELMANIP_00441


Location

lon / lat [deg]: 106.3603 / 13.8666

Source network: BELMANIP


Geostationary surface albedo (GSA) data


“+000”


“+057/+063”


Landcover information (based on ESA CCI landcover data)


Landcover fractions @ 2km distance


Landcover fractions @ 20 km distance


Legend


Distance to open water bodies [km]:

7.56

Distance to urban areas [km]:

14.48


Radius: 1 km

Number of landcover classes:

1

Dominant landcover type:

50: Tree cover, broadleaved, evergreen, closed to open (>15%)

Fraction of dominant landcover type [%]:

100.0


Radius: 2 km

Number of landcover classes:

1

Dominant landcover type:

50: Tree cover, broadleaved, evergreen, closed to open (>15%)

Fraction of dominant landcover type [%]:

100.0


Radius: 5 km

Number of landcover classes:

1

Dominant landcover type:

50: Tree cover, broadleaved, evergreen, closed to open (>15%)

Fraction of dominant landcover type [%]:

100.0


Radius: 10 km

Number of landcover classes:

5

Dominant landcover type:

50: Tree cover, broadleaved, evergreen, closed to open (>15%)

Fraction of dominant landcover type [%]:

90.0


Radius: 20 km

Number of landcover classes:

9

Dominant landcover type:

50: Tree cover, broadleaved, evergreen, closed to open (>15%)

Fraction of dominant landcover type [%]:

63.0


Disturbances


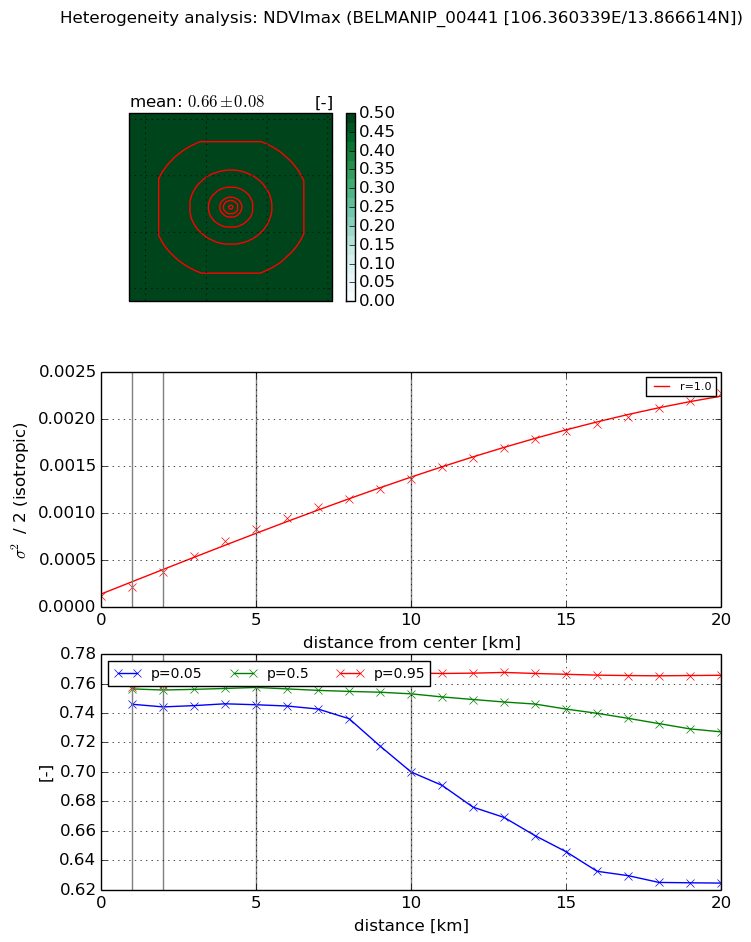
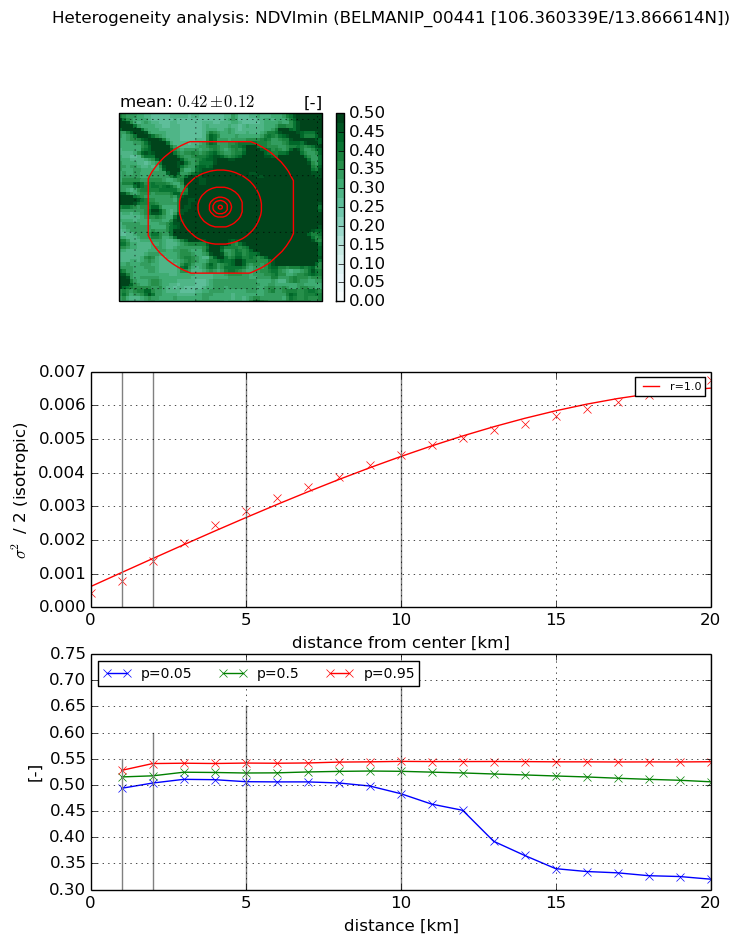
Heterogeneity analysis

The heterogeneity analysis provides information about the spatial and temporal heterogeneity of the site.

Topography


Roman et al. (2009) index


St

2.28734306726

Rcv

0.312066183195

Rse

0.0

Rst

-4.03556051288e-05

Rsv

-0.999458850294


Height range @ 1km [m]

19

Height range @ 2km [m]

21

Height range @ 5km [m]

33

Height range @ 10km [m]

-999

Height range @ 20km [m]

-999


Variance slope @ 1 km

50

Variance slope @ 2 km

38

Variance slope @ 5 km

31

Variance slope @ 10 km

-999

Variance slope @ 20 km

-999


NDVI (max. NDVI composite)


Roman et al. (2009) index


St

12.0031511578

Rcv

0.0157714026161

Rse

0.0

Rst

0.020030555175

Rsv

-0.214132410322


NDVI range @ 1km [-]

0.01

NDVI range @ 2km [-]

0.01

NDVI range @ 5km [-]

0.02

NDVI range @ 10km [-]

0.07

NDVI range @ 20km [-]

0.14


Variance slope @ 1 km

9.8468334907e-05

Variance slope @ 2 km

0.000129144575943

Variance slope @ 5 km

0.000147146309886

Variance slope @ 10 km

0.000127242838732

Variance slope @ 20 km

0.000107295205585


NDVI (min. NDVI composite)I


Roman et al. (2009) index


St

nan

Rcv

-0.0169416688766

Rse

nan

Rst

nan

Rsv

13.2966655902


NDVI range @ 1km [-]

0.03

NDVI range @ 2km [-]

0.04

NDVI range @ 5km [-]

0.04

NDVI range @ 10km [-]

0.06

NDVI range @ 20km [-]

0.22


NDVI slope @ 1 km

0.000347593974362

NDVI slope @ 2 km

0.000465179702958

NDVI slope @ 5 km

0.00050706375656

NDVI slope @ 10 km

0.00041724768766

NDVI slope @ 20 km

0.000305563668454


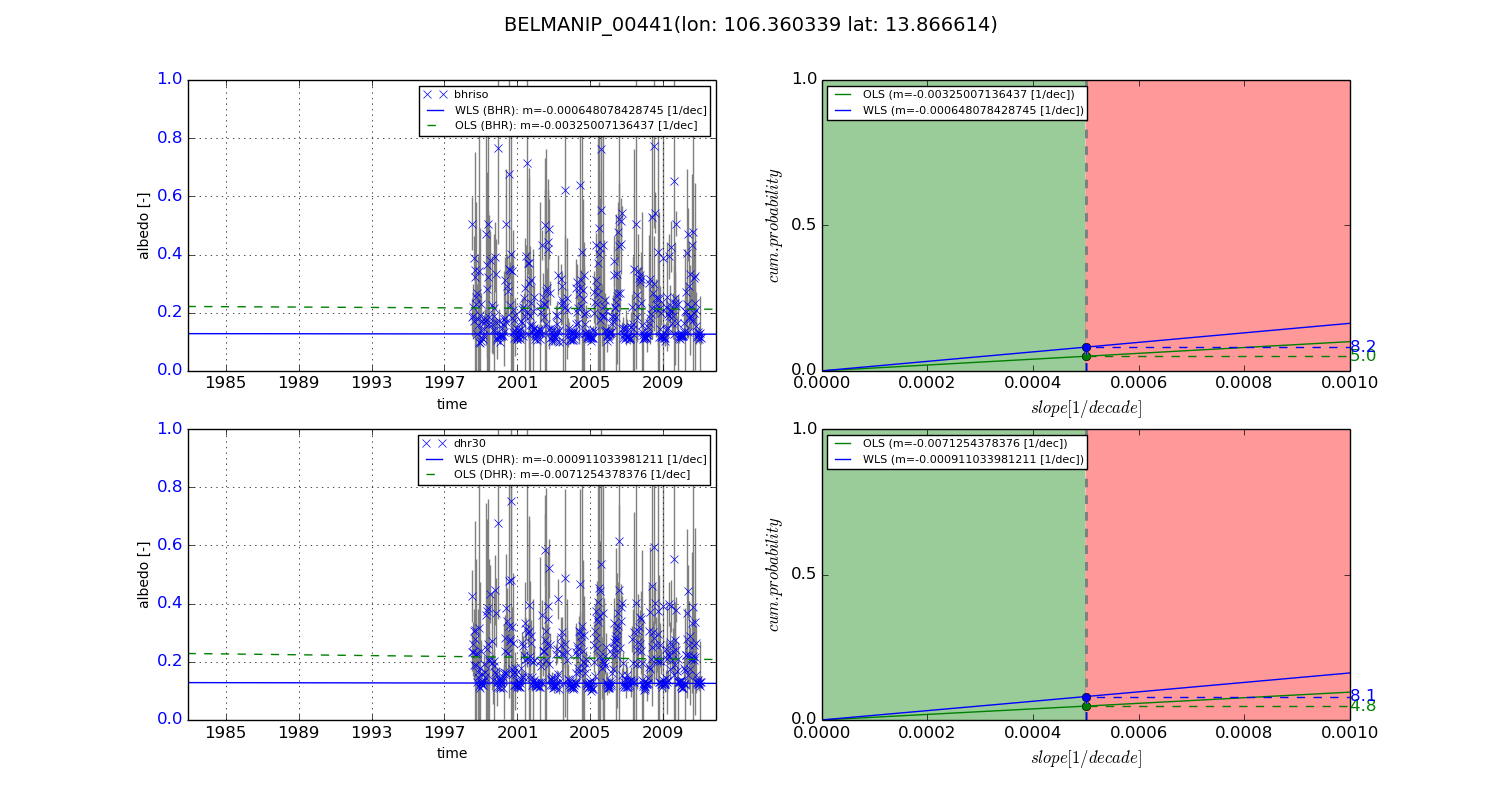
Temporal stability analysis

+000 deg (BHR)


BHR statistics

Temporal stability [1/decade]:


abs

rel


Weighted least square:

None


Ordinary least square:

None


Probabilities that GCOS criteria is met:

Weighted least square:

None %

Ordinary least square:

None %


DHR statistics

Temporal stability [1/decade]:


abs

rel


Weighted least square:

None


Ordinary least square:

None


Probabilities that GCOS criteria is met:

Weighted least square:

None %

Ordinary least square:

None %


+057/+063 deg (BHR)


BHR statistics

Temporal stability [1/decade]:


abs

rel


Weighted least square:

-0.000648078428745


Ordinary least square:

-0.00325007136437


Probabilities that GCOS criteria is met:

Weighted least square:

8.2 %

Ordinary least square:

5.0 %


DHR statistics

Temporal stability [1/decade]:


abs

rel


Weighted least square:

-0.000911033981211


Ordinary least square:

-0.0071254378376


Probabilities that GCOS criteria is met:

Weighted least square:

8.1 %

Ordinary least square:

4.8 %


Temporal anomaly analyis

The variance of the temporal anomalies provides an additional measure about the stability of the signal AFTER removal of the mean seasonal cylce.

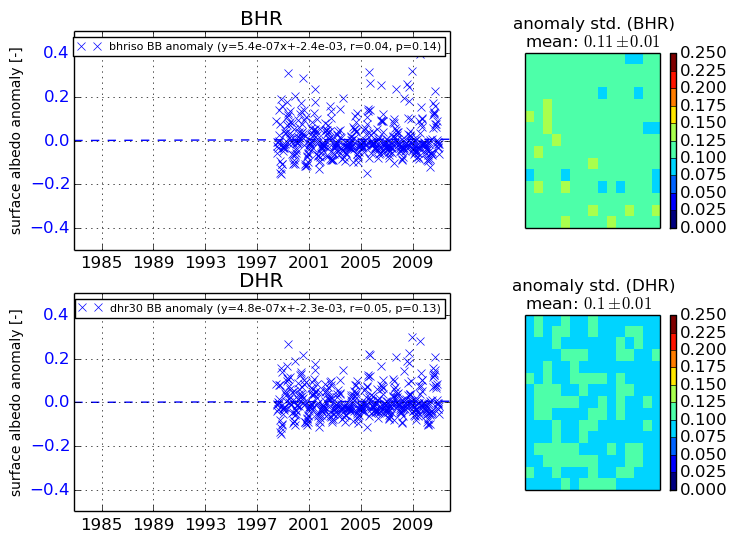
+000 deg


+057/+063 deg