BELMANIP_00445


Location

lon / lat [deg]: 99.18 / 12.6487

Source network: BELMANIP


Geostationary surface albedo (GSA) data


“+000”


“+057/+063”


Landcover information (based on ESA CCI landcover data)


Landcover fractions @ 2km distance


Landcover fractions @ 20 km distance


Legend


Distance to open water bodies [km]:

29.38

Distance to urban areas [km]:

44.81


Radius: 1 km

Number of landcover classes:

1

Dominant landcover type:

50: Tree cover, broadleaved, evergreen, closed to open (>15%)

Fraction of dominant landcover type [%]:

100.0


Radius: 2 km

Number of landcover classes:

1

Dominant landcover type:

50: Tree cover, broadleaved, evergreen, closed to open (>15%)

Fraction of dominant landcover type [%]:

100.0


Radius: 5 km

Number of landcover classes:

1

Dominant landcover type:

50: Tree cover, broadleaved, evergreen, closed to open (>15%)

Fraction of dominant landcover type [%]:

100.0


Radius: 10 km

Number of landcover classes:

1

Dominant landcover type:

50: Tree cover, broadleaved, evergreen, closed to open (>15%)

Fraction of dominant landcover type [%]:

100.0


Radius: 20 km

Number of landcover classes:

1

Dominant landcover type:

50: Tree cover, broadleaved, evergreen, closed to open (>15%)

Fraction of dominant landcover type [%]:

98.0


Disturbances


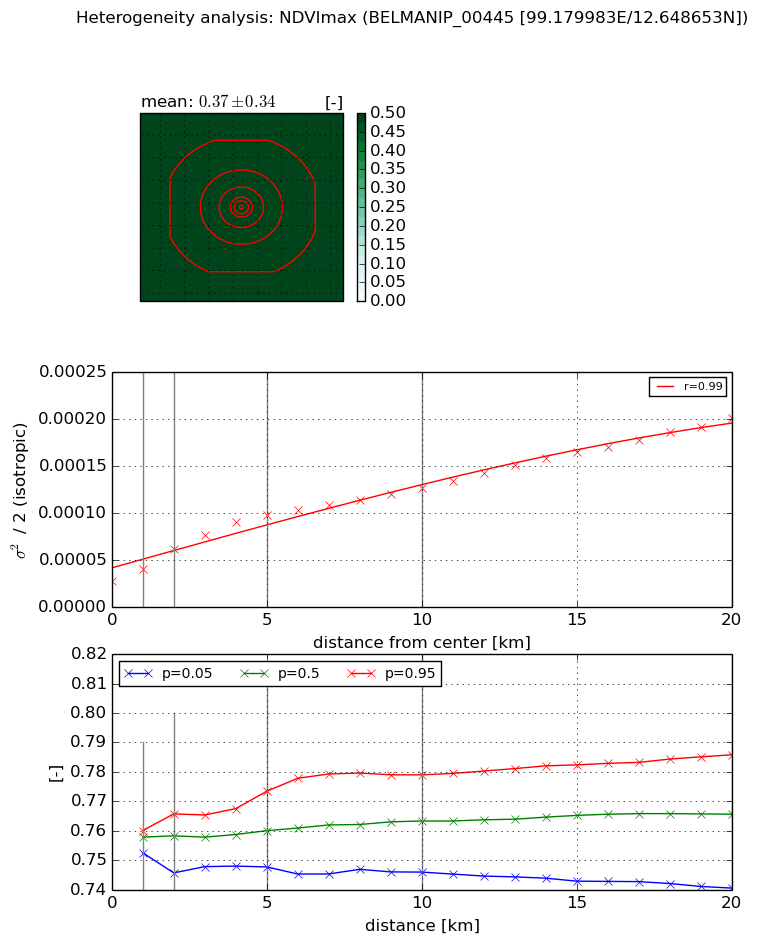
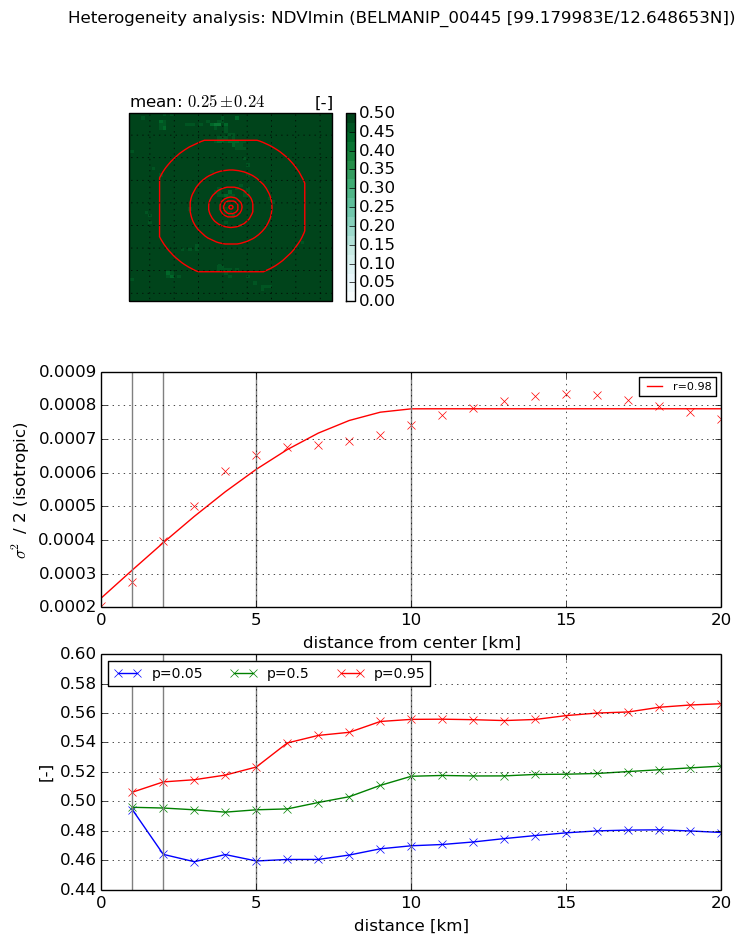
Heterogeneity analysis

The heterogeneity analysis provides information about the spatial and temporal heterogeneity of the site.

Topography


Roman et al. (2009) index


St

11.3112600955

Rcv

0.122158608108

Rse

0.0

Rst

-0.0602647632555

Rsv

0.0827990684595


Height range @ 1km [m]

292

Height range @ 2km [m]

349

Height range @ 5km [m]

525

Height range @ 10km [m]

-999

Height range @ 20km [m]

-999


Variance slope @ 1 km

10025

Variance slope @ 2 km

9132

Variance slope @ 5 km

5902

Variance slope @ 10 km

-999

Variance slope @ 20 km

-999


NDVI (max. NDVI composite)


Roman et al. (2009) index


St

1.57694374303

Rcv

0.373694129155

Rse

0.0

Rst

-0.528720145234

Rsv

-0.99999981823


NDVI range @ 1km [-]

0.01

NDVI range @ 2km [-]

0.02

NDVI range @ 5km [-]

0.03

NDVI range @ 10km [-]

0.03

NDVI range @ 20km [-]

0.05


Variance slope @ 1 km

1.35742650592e-05

Variance slope @ 2 km

1.70157759726e-05

Variance slope @ 5 km

1.47506708608e-05

Variance slope @ 10 km

9.48484941351e-06

Variance slope @ 20 km

7.82305200364e-06


NDVI (min. NDVI composite)I


Roman et al. (2009) index


St

1.22875234928

Rcv

0.0996477426681

Rse

0.0

Rst

-0.367940019623

Rsv

1.97391316485


NDVI range @ 1km [-]

0.01

NDVI range @ 2km [-]

0.05

NDVI range @ 5km [-]

0.06

NDVI range @ 10km [-]

0.09

NDVI range @ 20km [-]

0.09


NDVI slope @ 1 km

7.24303504502e-05

NDVI slope @ 2 km

9.65669673603e-05

NDVI slope @ 5 km

9.52867325142e-05

NDVI slope @ 10 km

5.2387689136e-05

NDVI slope @ 20 km

2.47523356966e-05


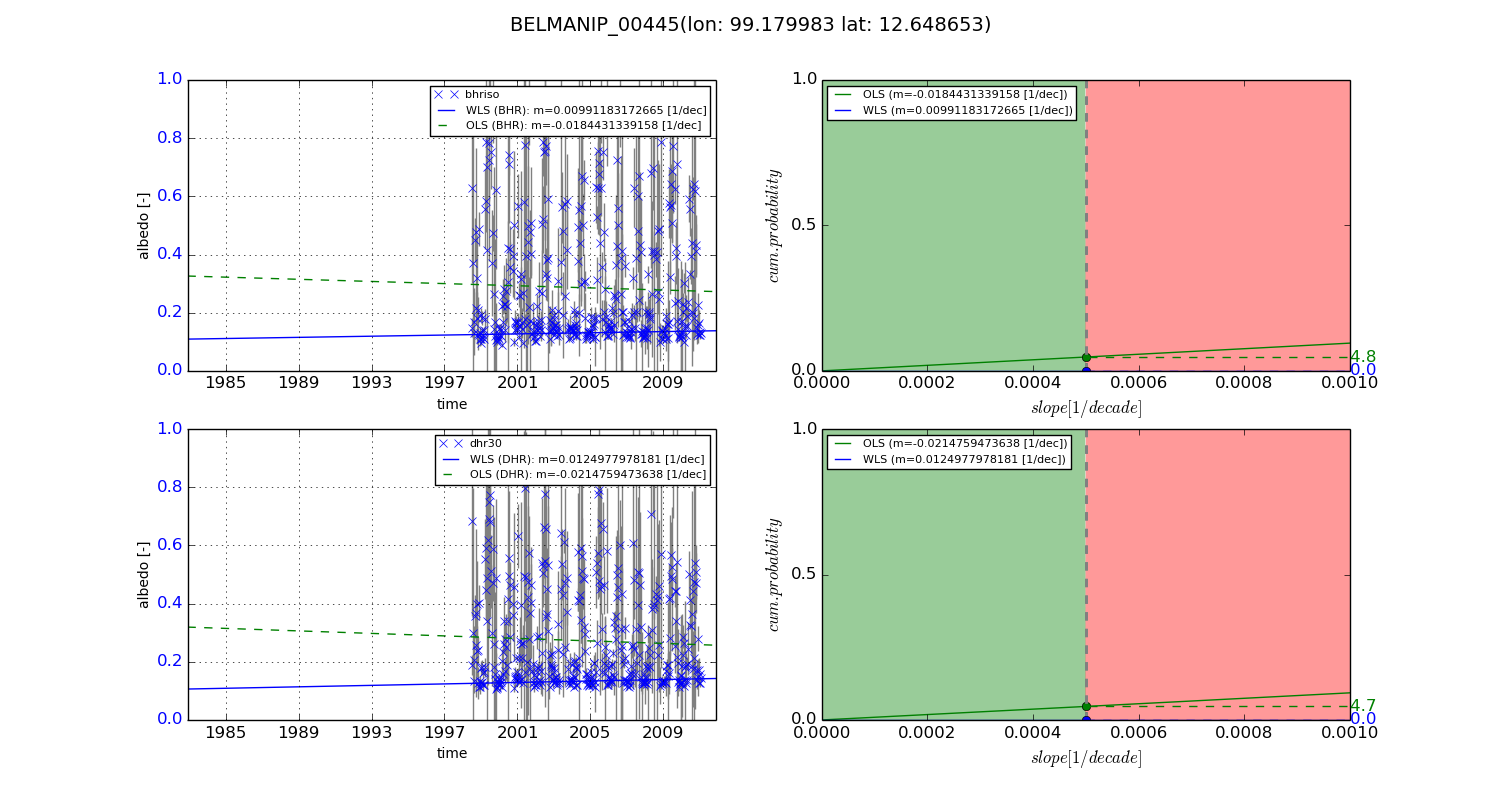
Temporal stability analysis

+000 deg (BHR)


BHR statistics

Temporal stability [1/decade]:


abs

rel


Weighted least square:

None


Ordinary least square:

None


Probabilities that GCOS criteria is met:

Weighted least square:

None %

Ordinary least square:

None %


DHR statistics

Temporal stability [1/decade]:


abs

rel


Weighted least square:

None


Ordinary least square:

None


Probabilities that GCOS criteria is met:

Weighted least square:

None %

Ordinary least square:

None %


+057/+063 deg (BHR)


BHR statistics

Temporal stability [1/decade]:


abs

rel


Weighted least square:

0.00991183172665


Ordinary least square:

-0.0184431339158


Probabilities that GCOS criteria is met:

Weighted least square:

0.0 %

Ordinary least square:

4.8 %


DHR statistics

Temporal stability [1/decade]:


abs

rel


Weighted least square:

0.0124977978181


Ordinary least square:

-0.0214759473638


Probabilities that GCOS criteria is met:

Weighted least square:

0.0 %

Ordinary least square:

4.7 %


Temporal anomaly analyis

The variance of the temporal anomalies provides an additional measure about the stability of the signal AFTER removal of the mean seasonal cylce.

+000 deg


+057/+063 deg